Build GitHub star history tracker in 10 minutes using low-code

Shubhendra Singh Chauhan
Posted on January 21, 2022

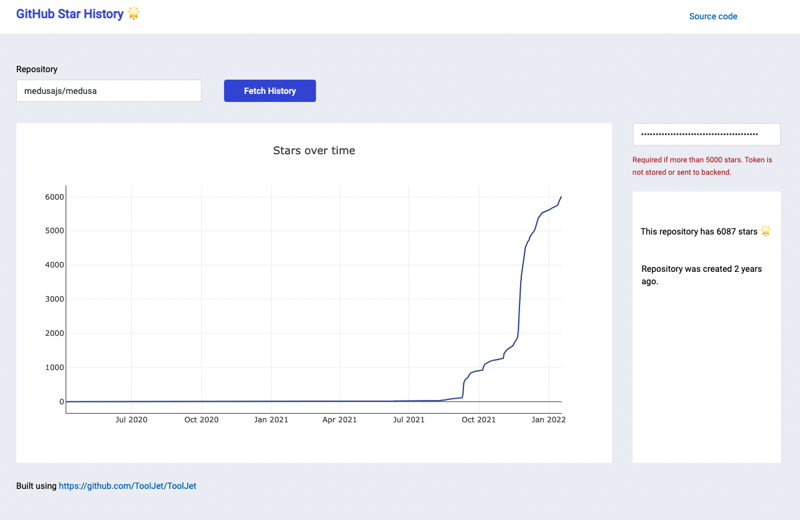
In this tutorial, we’re going to build an app that can be used to track the stars count of public GitHub repositories over time.
Overview
If you’re a developer who owns/maintains a project on GitHub and wants to track the growth of GitHub stars of your repository then this app is going to be very useful for you. You can either build this app or you can use the live demo that we built here - https://apps.tooljet.com/github-star-history.
For building this application we will use ToolJet (https://github.com/tooljet/tooljet) which is a free and open-source, low-code platform that allows you to quickly build tools, GitHub APIs for getting the repository information like stars count and date, GitHub personal access token only if the stars count of a repository is higher than 5000.
💡 ToolJet provides an option to import and export applications. You can download the exported source code of this app from here and import it to your personal ToolJet account.
Building this application using ToolJet is super easy and I have broken down the whole tutorial into the following parts:
- Build the UI
- Create the queries
- Add properties to widgets
- Make app live
Build the UI
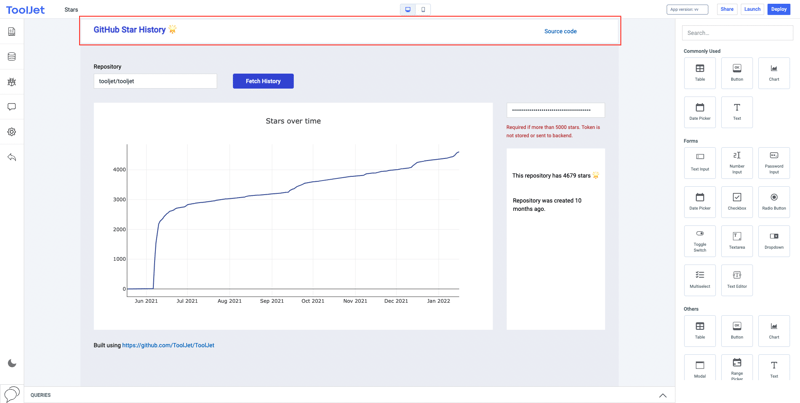
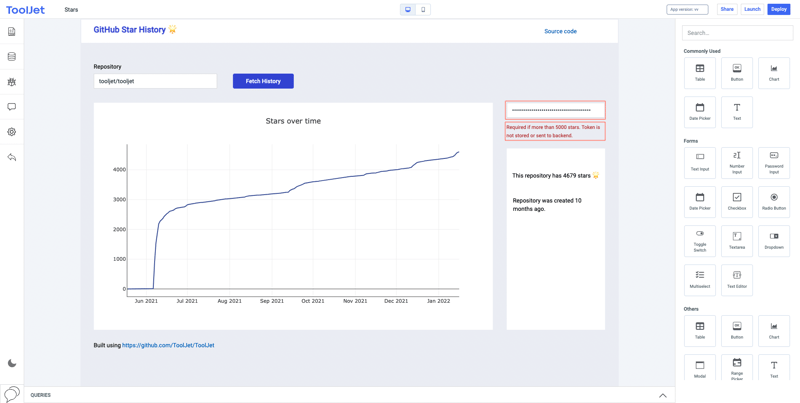
Let’s start with building the user interface of our application first. To build the user interface, we will be using widgets like containers, text, text-input, button, and chart. Here’s my version of user-interface built using the following widgets:
- A container that includes a text widget inside it to build the header including the title of application.
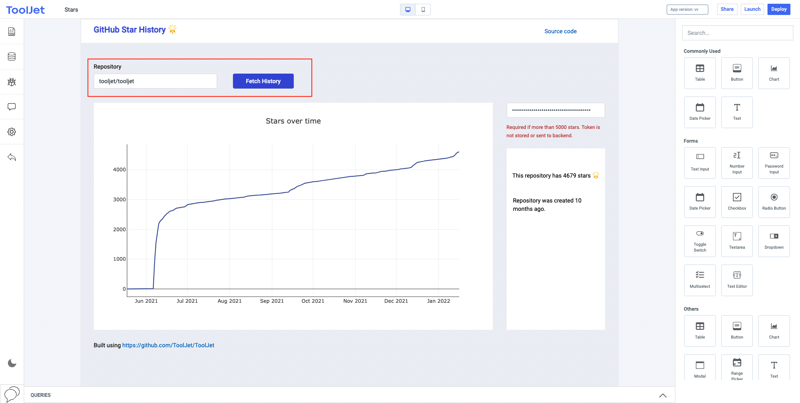
- A text-input and a button next to it. The text-input will be used to get the repository name in this format:
account/repo-nameand the button will be used to perform the action to run the query.
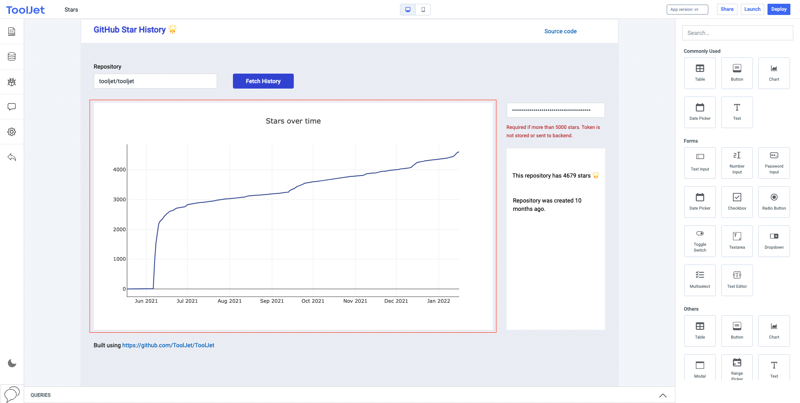
- A chart widget (line graph) to display the changes in stars count over time.
- A password-input widget and a text widget below it. Password-input widget to hold the GitHub personal access token and the text widget to add the display the message.
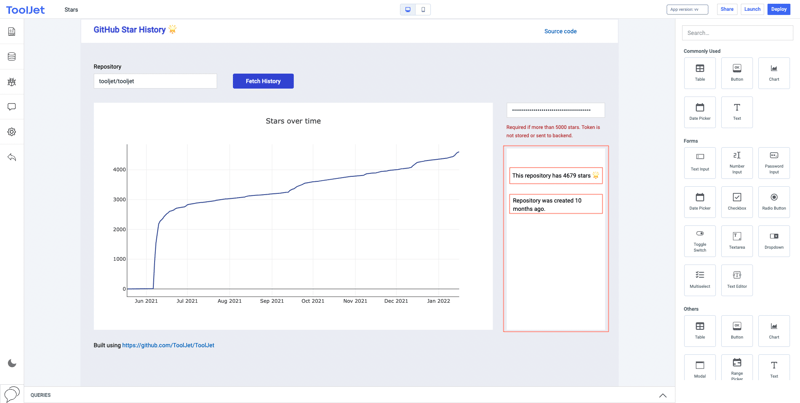
- And finally a container that includes two text widgets, one to display the total stars count of the repository and the other to display the time when the repository was created.
💡 You can always make use of more widgets to build a better UI and customize or style widgets by changing their property from the inspect panel.
Create the queries
Now, we will create the queries that will get the repository information like stars count and date.
We will be creating two queries - one using REST API datasource and the other using custom JavaScript code.
First query using REST API
This query will get the data from GitHub like stargazers_count and the the time when the repository was created_at . Let’s create the query:
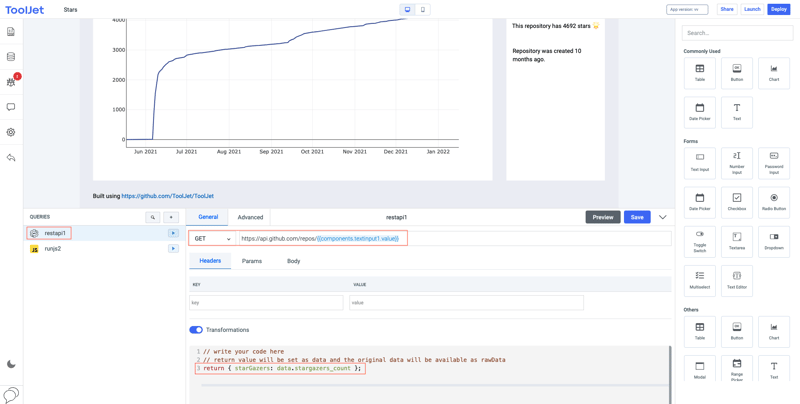
- Go to the query editor at the bottom and click on the
+button to create a new query - Select REST API from the datasource dropdown
- In the General tab, Select
GETmethod and enter the GitHub’s API endpointhttps://api.github.com/repos/{{components.textinput1.value}}- at the end of URL we have used JavaScript inside double curly brackets. This will use the value from the text-input widget. - We will use Transformation to convert the data received from the response of API into JSON format. Enter
return { starGazers: data.stargazers_count };- this will get thestargazers_countfrom the response received using API and will create a key value pair. (You can check the documentation to know more about the Transformation) - Now you can click on Preview button to check result of the query in preview section and then click on Save to create the query.
Perfect! we have created our first query that will get the repository data like total stargazers at the moment and the date when the repository was created. Let’s move on to build another query.
Second query using custom JavaScript code
To build this query we will be writing some JavaScript code to get the data specifically of stargazers. We will be fetching the data like the number of stargazers on a particular date and then we will use this data to create key: value pairs of date and number of stargazers on that particular date. This will be used to build the line chart for graphical representation of change in stargazers over time. Let’s create the query:
- Go to the query editor and click on the
+button to create a new query - Select Run JavaScript code from the datasource dropdown
- Write the JavaScript code in the editor:
- Let’s define a variable starsgazerURL and assign the GitHub API to it - const stargazersURL =
https://api.github.com/repos/${components.textinput1.value}/stargazers?per_page=100&page={page}; . - totalPages variable that will store the parsed integer value of total number of pages - const totalPages = parseInt(queries.restapi1.data.starGazers/100);
- pages variable that will create an array from total number of pages - let pages = [...Array(totalPages).keys()];
- Create an empty object dates - let dates = {};
- Create an empty array results - let results = [];
- For headers we will assign the media type supported by GitHub’s REST API - let headers = {'Accept': 'application/vnd.github.v3.star+json'}
- If condition to accept the GitHub personal access token from the text-input - if(components.passwordinput1.value !== '') { headers['Authorization'] =
token ${components.passwordinput1.value}} - A for-loop that will replace the page number in the starGazersURL and then iterating through all the stars to get a list of all stars and the time at which they starred:
- Let’s define a variable starsgazerURL and assign the GitHub API to it - const stargazersURL =
for(const page of pages) {
  const url = stargazersURL.replace('{page}', page + 1);
  const data = (await axios.get(url, { headers })).data;

  for(star of data) {
    const starredAt = moment(star.starred_at).endOf('day').format('yyyy-MM-DD');
    dates[starredAt] = (dates[starredAt] || 0) + 1;
  }

}
- And at last the assigning total to 0 and iterating through every date in dates object. Then creating array of objects and pushing to results array:
let total = 0;
for (date of Object.keys(dates)) {
    total = total + dates[date];
    results.push({ x: date, y: total});
}

return results;
- Once done writing the code, Save this query. Here’s the complete code:
const stargazersURL = `https://api.github.com/repos/${components.textinput1.value}/stargazers?per_page=100&page={page}`;

const totalPages = parseInt(queries.restapi1.data.starGazers/100);

let pages = [...Array(totalPages).keys()];

let dates = {};
let results = [];

let headers = {
  'Accept': 'application/vnd.github.v3.star+json'
}

if(components.passwordinput1.value !== '') {
  headers['Authorization'] = `token ${components.passwordinput1.value}`
}

for(const page of pages) {
  const url = stargazersURL.replace('{page}', page + 1);
  const data = (await axios.get(url, { headers })).data;

  for(star of data) {
    const starredAt = moment(star.starred_at).endOf('day').format('yyyy-MM-DD');
    dates[starredAt] = (dates[starredAt] || 0) + 1;
  }

}

let total = 0;
for (date of Object.keys(dates)) {
    total = total + dates[date];
    results.push({ x: date, y: total});
}

return results;
We will also add an event handler to our first query to run the second query every time the first query is successful. To do that we need to go to the Advanced tab of our first query and then create a new handler. Select the On Success Event and in Action dropdown select Run Query, then select the second query and save it.
Adding properties to widgets
So now that we have successfully built the user interface and created the queries, all we need to do now is configure the widgets to function correctly. Let’s configure the widgets:
Text-input
We don’t need to configure anything specific in this widget. It is used to get the input from user. Once the user has entered the repository name in the correct form then the queries will automatically fetch the value from the widget. We can add a placeholder for the users to understand the correct format to enter. Just click any where on the widget to open the inspect-panel on the right and in the Placeholder box enter account-name/repo-name .
Button
We will need to make several changes in the property of the button widget. It is the widget that will be used to trigger the queries and make our whole application work.
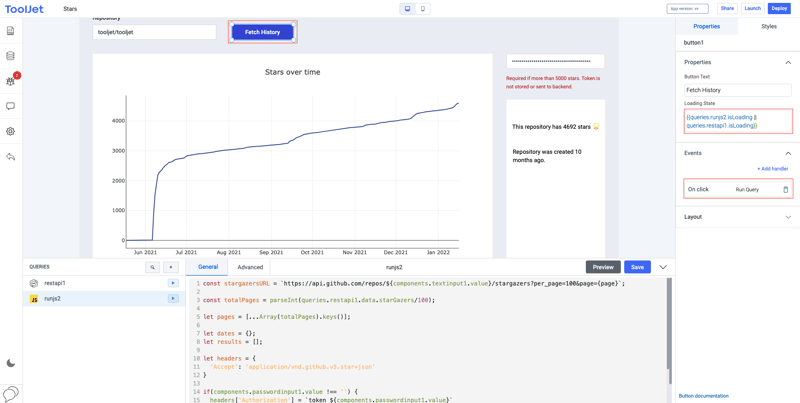
- The first thing that we can do is add a text to our button like
Fetch dataand change the colour of button from the Style tab. This will improve the UI of button. - Let’s add functionality, we can add the Loading state to our button so that it shows a loader until the a query has done getting the results. To do this, just add
{{queries.runjs2.isLoading || queries.restapi1.isLoading}}this will display a loading state to the button while either of the queries run. - Now finally, add an event handler to the button so that whenever the button is clicked an action is performed. In this case, we will create
On Clickevent, addRun Queryaction to it, and will select the first query. When the button will be clicked it will run the first query in the backend.
Password-input
Just like the text-input widget, all we need to do is add a Placeholder to this widget - GitHub token so that the user knows to input the GitHub token. Learn how to get GitHub personal access token here.
Text widget below password-input
We will use this text to display it as a message for the password input field. Just click on the widget and add the text - <small>Required if more than 5000 stars. Token is not stored or sent to backend.</small> and from Style tab use the color picker to change the font color to red.
💡 You can use HTML to customize the text.
Text widgets inside containers
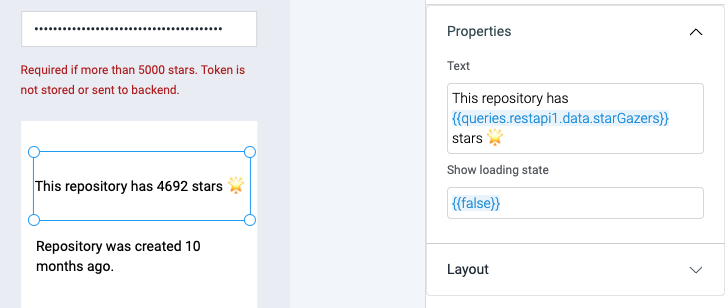
We will use two text widgets inside the container. The first one is to display the number of total stars. Click on the widget to edit its property and add the following text: This repository has {{queries.restapi1.data.starGazers}} stars 🌟 this uses JavaScript inside double curly brackets to get the number of starGazers from the data fetched by the restapi1 .
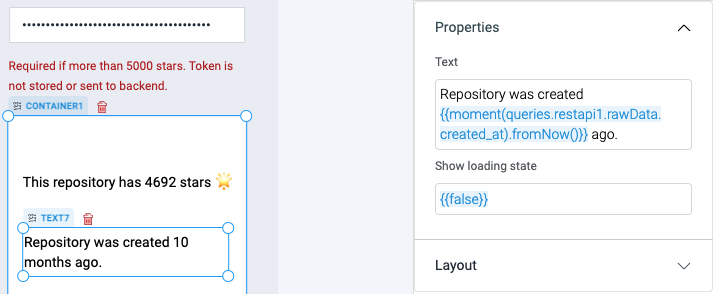
And the second text displays the time when the repository was first created. Click on the widget to edit its property and add the following text: Repository was created {{moment(queries.restapi1.rawData.created_at).fromNow()}} ago this will use JS functions to moment and fromNow to convert the created_at date received in data fetched by the restapi1 .
Chart
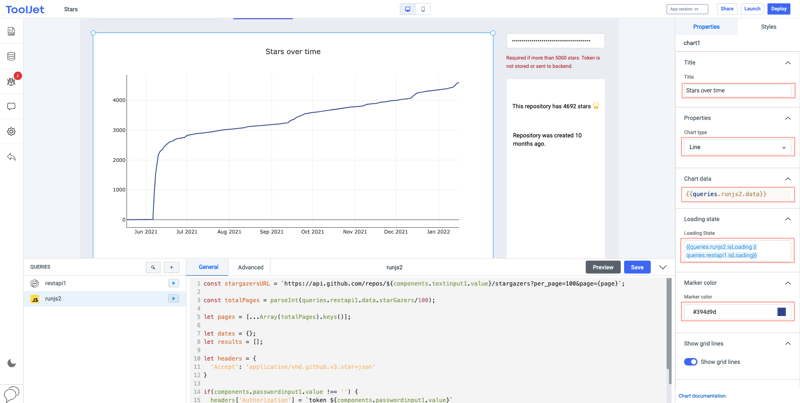
We will edit 4 properties of the Chart:
-
Title: This title will display at the top-center of the chart
Stars over time. - Chart type: ToolJet support different chart types including line, bar, and pie. We will use line chart.
-
Chart data: We will use the data fetched and converted into array of objects by the query
runjs2-{{queries.runjs2.data}} -
Loading state: The chart will display a loading state until the query has successfully fetched and converted the results -
{{queries.runjs2.isLoading || queries.restapi1.isLoading}}
Great! we are almost done with our app, now we will see how to deploy it and share it with our friends and community.
Make app live
To do this just click on the Deploy button on the top-right corner. On the dialog box:
- Click on the +Version button to create a version of the app
- Click on the Save button to save the progress and then click on the Deploy button to deploy on the server
Making app shareable:
- Click on the Share button on the top-right
- In the dialog box, click on the toggle switch to make the application public and shareable through the link in the box
- You can also edit the URL according to your choice
Congrats 🎉 **** : You’ve successfully built an app that lets you track the GitHub stars history just by entering the repository name and get the details like Total stargazer over time and time when it was created. If you run into any problems, always feel free to reach out to us on our slack community or email us at hello@tooljet.com.

Posted on January 21, 2022
Join Our Newsletter. No Spam, Only the good stuff.
Sign up to receive the latest update from our blog.
