How can you monitor EntireX using Command-line Scripts?

tonipetov
Posted on October 16, 2019
webMethods EntireX
EntireX provides command-line scripts to monitor EntireX components on any platform. They are installable and runnable under Windows®. You can use these scripts to monitor EntireX components on any other operating system.
By Jürgen Lind, Director, Product Management, Software AG and Peter Hofer, Sr. Lead Software Engineer, Software AG
| Issue 4, 2017 |  Download PDF Download PDF |
|---|
Use these scripts to:
- Get an overview of a specific EntireX Broker and the registered services
- Monitor an EntireX Broker, services or clients and collect the data in a .CSV file
- Monitor a user-defined EntireX environment with brokers and services
How can you get the command-line scripts?
The command-line scripts have been included in the EntireX installation on Windows since Version 9.7.
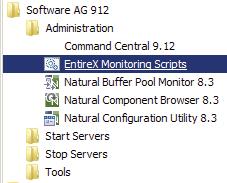
After installation, you will get a shortcut to the monitoring scripts in your Windows start menu. You can find it under <your installation name> -> Administration, as shown in Figure 1.
Fig. 1: EntireX Monitoring Scripts in the Windows Start Menu
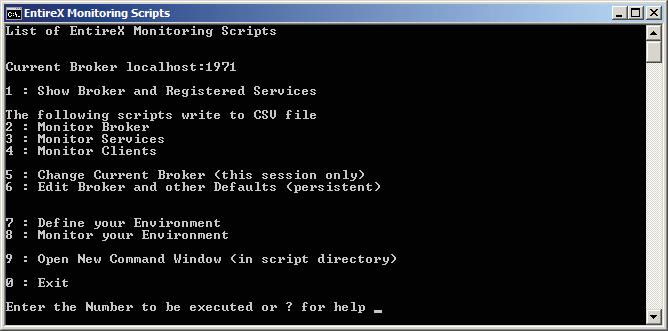
Select the EntireX Monitoring Scripts menu to start the scripts. You can also start the bat file “Menu_Of_EntireX_Monitoring_ Scripts” from the EntireX\bin directory of your installation. They appear within a Windows command shell as shown in Figure 2.
Fig. 2: EntireX Monitoring Scripts in the Command Window
As you can see, the following services are offered by the menu:
- Provide an overview about broker and active services (1)
- Monitor broker, services or clients to a CSV file (2 – 4)
- Switch to another broker (5 and 6)
- Define and monitor your environment (broker and services) (7 and 8)
By default, after installation, the default broker of a local installation will be set by the scripts. In case you want to monitor a different EntireX Broker, you need to adjust this setting. You can change the broker temporarily (for this session only, see option 5) or permanently (see option 6). Any broker accessible in the network can be specified. For example you can use the scripts to monitor a broker running on the mainframe.
All scripts use ETBINFO to get the requested information and provide selected KPIs for the monitored components.
How can you get an overview of the broker and registered services?
Start the first option (1) in the EntireX Monitoring Scripts menu to get an overview of the specified broker and the registered services.
For the broker you see the version, information where the broker is running, license information and some basic settings.
For the registered services you see the class/server/service to identify the service. For each service, basic KPIs such as number of active replicates (active server instances),
maximum of pending parallel conversations and number of times all server instances were busy are shown. A high number on the last KPI (in relation to the total number of requests) may indicate that more replicates could help to improve the performance.
Note that this script just displays the information and then it stops. See Figure 3 for sample output.
Fig. 3: Overview of a Broker and Registered Services
How do you monitor EntireX components such as broker, services or clients?
Use options 2 – 4 of the EntireX Monitoring Scripts menu to monitor the broker and (selected) services or clients over a longer time. The scripts will run until they are canceled. They will write basic KPIs to a CSV file.
The CSV files are written to My Documents/Software AG/EntireX. They are updated every 60 seconds with the latest information. You may want to adjust these defaults with menu option 6.
In the CSV file created by the monitor broker script (option 2), you see the time when the report was taken, the time (in seconds) the broker was running (uptime), the numbers of active workers, servers, services and clients, the allocated memory and the High Water Marks (HWM) for servers, clients, conversations and memory. See Figure 4 for sample output.
Fig. 4: Example of the CSV file for Monitor Broker
In the CSV file created by the monitor services script (option 3), you see the time when the report was taken, and for each service (that matches the selection) the class/server/service, which identifies the service, the numbers of active servers providing this service, the number of requests for this service and information about the conversations. The server busy (count) is the number of times an incoming request had to wait because all instances of the server were busy. A high number (in relation to the total number of requests) may indicate that more replicates could help to improve the performance. See Figure 5 for sample output.
Fig. 5: Example of the CSV file for Monitor Services
In the CSV file created by the monitor clients script (option 4), you see the time when the report was taken, and for each active client the userid, token, unique ID that identifies the client, the status (waiting or not waiting), the start time of the client, the host name where the client is running and information about the application. See Figure 6 for sample output.
Fig. 6: Example of the CSV File for Monitor Clients
The CSV files for monitoring of clients and servers can have multiple lines for a measurement at a specific time (for example if more than one registered service matches the selection criteria).
How do you monitor your user-defined environment?
You can monitor your user-defined environment with the monitoring scripts. Define your environment(s) with option 7, then select option 8 of the monitoring scripts menu to start the monitoring.
Example:
Your production broker runs on the mainframe “mymainframe” listening on port 1971. You application requires an RPC server in CICS® (running with class RPC, server name CICSSRV and service CALLNAT). In addition, your production also requires a batch RPC server (running with class RPC, server name BATCHSRV and service CALLNAT). In addition you also want to monitor an ACI server running with class ACLASS, server name ASERVER and service ASERVICE.
Define your environment (using option 7) as:
ENVIRONMENT MyProductionServers
ERROREXIT handle_error.bat
BROKER myProductionBroker mymainframe:1971
@rem definition of the CICS RPC Server
RPCSERVICE myCICSRPCServer RPC CICSSRV CALLNAT
@rem definition of the Batch RPC Server
RPCSERVICE myBATCHRPCServer RPC BATCHSRV CALLNAT
@rem definition of the ACI Server
SERVICE myACIServer ACLASS ASERVER ASERVICE
Use the keyword ENVIRONMENT to specify your name for the environment.
With ERROREXIT, you specify the (user-written) error exit to be called in case of an outage (broker or service not available). See handle_error.bat in the EntireX/bin directory as an example. The error exit can be used, for example, to send a notification in case of an outage.
You define the components to be monitored with the keywords BROKER, RPCSERVICE and /or SERVICE. The script will check if the defined Broker can be called. SERVICE definitions will check if the defined service is registered at the broker. RPCSERVICE will issue an RPC PING to check if the service can be called.
By default the script will check the components of the environment every 60 seconds and will call the specified error exit if a component is not available.
To learn more, read Monitoring EntireX with Command-line Scripts from the webMethods EntireX documentation.
Summary
You have been presented with the features of the EntireX Command-line scripts to monitor your EntireX environment. You’ve seen how it provides a short overview of the broker and registered services. You also can monitor a component over a longer time or you can monitor your user-defined EntireX environment.

Posted on October 16, 2019
Join Our Newsletter. No Spam, Only the good stuff.
Sign up to receive the latest update from our blog.
Related
September 27, 2019


