Sending Function logs to Log Analytics

Sameer Jejurkar
Posted on October 16, 2022
In the previous article, we deployed our simple function with Storage Queue trigger to Azure cloud. We saw how to view the log stream of our Function App. While reviewing logs this way is fine for testing, it is not a practical solution once the function is deployed and running. We simply cannot watch log stream all the time. Besides, it also means that we have to leave the browser tab open for the log stream to continue. In this article, we will configure our Function App to send logs to a centralized location using Azure Log Analytics.
Create Log Analytics Workspace
First, we will create a Log Analytics Workspace for collecting our function logs. Let's go to Azure Portal and search for log analytics resource. Click on Log Analytics workspaces in the search results.
Click on + Create to specify the details of the workspace.
We will create this new workspace in our existing blog-functions-rg resource group. We will name this workspace blog-functions-log-analytics-ws and specify region East US that we have used so far. Click on Review + Create to continue.
We should see a Validation passed message. Click on Create to create the workspace.
Configure Function App Diagnostics Settings
After the workspace is created, it needs to associated with our Function App so the logs can be routed to this workspace. To do this, we will navigate to our Function App and click on Diagnostic settings item in the left menu. In the panel that opens on the right, we will click + Add diagnostic setting.
We will name this setting blog-function-app-log-diag-settings. Since we want to send function logs to the workspace we created, check the Function Application Logs and the Send to Log Analytics workspace boxes. Choose the workspace we just created in the Log Analytics workspace list. Click Save at the top to save this setting.
We should now see the setting in the list of Diagnostic settings of our Function App. 
Invoke HTTP Function
We need to generate some logs before we can view them. For this, let's invoke our HTTP function. Open a new browser or tab, put URL https://blog-function-app.azurewebsites.net/api/SimpleHttpFunction into the address bar and press enter.
Note: Each function logs a single message. We will look for these messages in the log workspace.

View Logs
Now let's see if the logs show in the Log Analytics workspace. We will navigate to our workspace and click on Logs item in the left menu. We can close the pop-up that appears on the right as we won't be using any of these queries. Instead, we will write our own query.
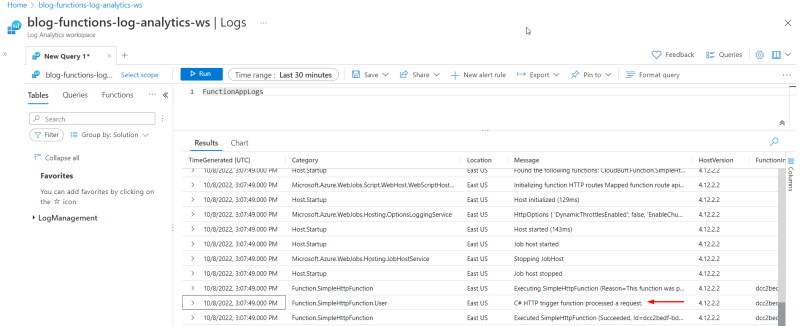
Azure Log Analytics uses Kusto Query Language (KQL) to help query and filter logs. After closing the pop-up, note that the scope is our workspace name. Select Last 30 minutes as the Time range, specify FunctionAppLogs as the query text and click Run button. We will see logs appearing under the Results tab.
Note: There can be a delay of a few minutes for the logs to make it to the workspace.
There will be a lot of messages. Azure itself writes a lot of information to the workspace. Scroll down and look for message with Category as Function.SimpleHttpFunction.User and you should see the log message written by the function.
Next, let's get our SimpleQueueFunction to run. Go to the blog-queue and add a new message { "msg": "Write to log analytics" } to the queue (see previous article for details). 
When we run the query again in Log Analytics workspace, we should see the message logged by SimpleQueueFunction. Clicking the > sign will expand the details.
Advanced Log Analytics Queries
As mentioned earlier, we can use Kusto Query Language (KQL) to query logs. When we invoked our HTTP function, a lot of messages were generated. This is going to happen every time a function is executed. If there are many function executions, there will be a large number of messages and these could be from different functions. This makes it very difficult to get to the messages that we actually need to review. KQL is quite powerful and we can use its filtering capabilities to narrow down the messages we are interested in. For e.g., to look for messages generated by a specific function, we can use a query like this:
FunctionAppLogs
| where Category startswith "Function."
| where FunctionName == "SimpleQueueFunction"
| project TimeGenerated, FunctionName, Level, FunctionInvocationId, Message
| order by TimeGenerated desc
The above query will retrieve messages generated by our code as well as those generated by Azure. To see messages from only our code, we can add a where Category endswith ".User" filter.
FunctionAppLogs
| where Category startswith "Function."
| where Category endswith ".User"
| where FunctionName == "SimpleQueueFunction"
| project TimeGenerated, FunctionName, Level, FunctionInvocationId, Message
| order by TimeGenerated desc
Notice that KQL appears to be similar to SQL. Here FunctionAppLogs is the table. Data from this table can be filtered using where clauses and project clause can be used to include only the fields that we are interested in (like select clause in SQL). Ordering of results is also supported.
Checkout a few advanced KQL query examples in my Github repo.
Conclusion
In this article, we set up a Log Analytics workspace and configured our Function App to send logs to it. This workspace acts as centralized location for retrieval and analysis of logs. We also saw how we can query and filter logs using KQL.
Note: It is possible to use the same Log Analytics workspace to collect all your logs - such as those from other Function Apps, App Services, Virtual Machines etc.
In the next article, we will take a look at Function App bindings.

Posted on October 16, 2022
Join Our Newsletter. No Spam, Only the good stuff.
Sign up to receive the latest update from our blog.


