Grafana Time-Series Dashboards with the Rockset-Grafana Plugin

Shawn Adams
Posted on September 20, 2019
Authored by Rui Aguiar
What Is Grafana?
Grafana is an open-source software platform for time series analytics and monitoring. You can connect Grafana to a large number of data sources, from PostgreSQL to Prometheus. Once your data source is connected, you can use a built-in query control or editor to fetch data, and build dashboards from your data source. Grafana is frequently deployed for a wide variety of use cases, including DevOps and AdTech.
At Rockset, we primarily use Grafana for monitoring our production systems, as well as for DevOps purposes. We track a wide variety of metrics, from the number of query errors to the CPU usage of our production machines. Whenever a graph deviates from a predefined band of expected values, we trigger an alert which can connect to something like a PagerDuty integration that would ping an on-call engineer.
Why Build a Plugin?
As power users of Grafana ourselves, we had floated the idea of building a Rockset connector for Grafana for a long time. Because of the realtime nature of Rockset as an operational analytics engine, we believed that a Grafana plugin could be a good fit for a wide range of problems and queries. We realized that we could begin tracking a lot of time series metrics that would allow for greater transparency into our engineering practices (by tracking the pulse of our GitHub commits into master, for example), as well as our internal systems that we are monitoring through Rockset (such as events in our Kubernetes cluster). Another reason a Rockset-Grafana plugin is helpful is because an application developer can use standard SQL to fetch any kind of data through Rockset. Finally, it was something that our customers had previously expressed interest in. Taking these points into account, building a Grafana connector seemed like an obvious and useful application of Rockset to enhance an already powerful tool.
How To Build A Grafana Connector
To build a working Grafana connector, one needs to implement a collection of Typescript methods, as well as a custom user interface for retrieving data from your given datasource. After the plugin has been implemented and test cases written, it is reviewed by the Grafana maintainer team and integrated into the official list of plugins.
The functionality that any Grafana connector needs to implement is:
- Datasource Specification
When building a plugin, you need to first actually be able to fetch the data you will be constructing dashboards out of. This generally involves having the user specify an API key, password, or database connection URL to fetch the data from.
- Custom Query Interface
Once a datasource has been specified, a user needs to be able to query that datasource. In the case of Rockset, this involved implementing a custom query editor in HTML and AngularJS that is shown to the user when they are creating a dashboard with Rockset.
- Query Execution through the API layer
After the user has typed in a query, the data itself needs to actually be fetched and passed to the visualization layer in a very specific format. This involves communicating with the frontend through the user’s query editing, as well as query execution through the Rockset API and post-processing of results such that they are passed to the visualization in the proper timeseries format.
Building the Rockset-Grafana Plugin
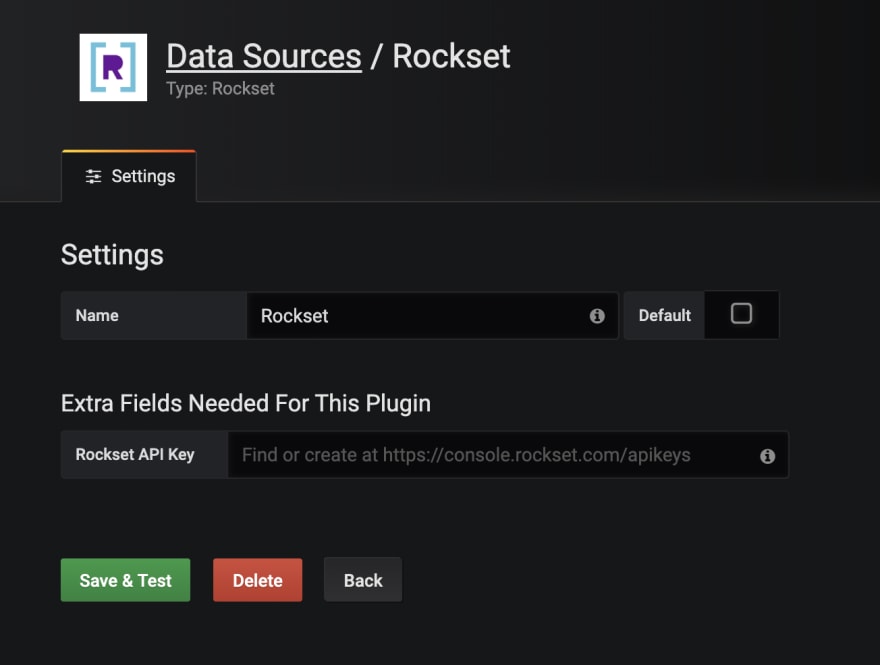
Going back to the steps outlined above, the first thing that I needed to do when building out the Rockset Connector was to actually connect the Rockset Datasource. I built out a form that allowed a user to specify the name of the plugin, as well as the Rockset API key. This involved building out the form on the frontend, as well as writing a testDatasource method that validated the proper API key with a test query to the Rockset backend through a quick call to the /v1/orgs/self/users/self/apikeys endpoint in the Rockset API that ensured the API key itself was valid.
Once the key was validated, it was time to build out the query editor. In the case of Rockset, we have to allow a user to type in arbitrary SQL to any of their collections. Additionally, it is important to provide informative error messages for syntactically invalid queries or if a user is querying on a collection that does not exist.
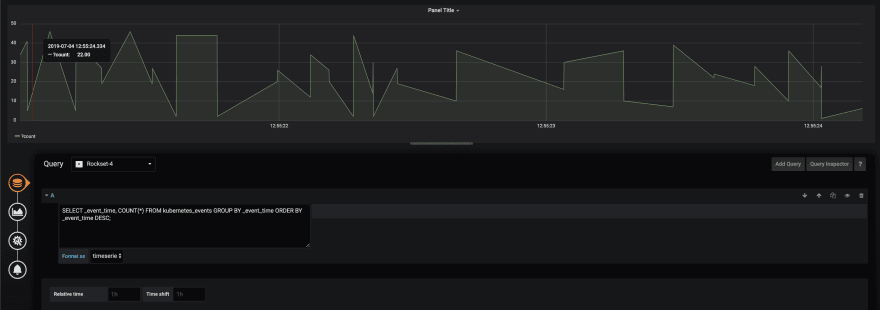
I implemented the query editor with a debounce function that allowed a user to type their query, then pause so it could be executed through the Rockset API. The queries are checked for validity on the backend, and the error is passed to the user on the frontend so they can receive an informative error message. Additionally, Grafana requires a timeseries column if you want to express the data in terms of an over-time graph. The Timeseries column box allows a user to specify a column in their SQL results that they choose to pivot their graph axes on. The Format as box is a simple dropdown that allows a user to express a Rockset query as a timeseries or as a table, and this changes the formatting of the data passed to the graph layer.
After a query has been typed in, validated, and executed, the data is received by the Grafana connector. Unfortunately, we cannot simply pass the data to a table or graph and display it in the Grafana dashboard. We need to extract the user-specified timeseries column, convert it into Unix seconds, and pass an array of JSON objects into the visualization layer of Grafana. We can also smartly suggest the timeseries column if a user specifies only one column that is of type datetime.
Finally, once all of the query and validations steps have been completed, it’s now possible for a user of the plugin to visualize their data, and we immediately set about doing that after the plugin had finished being developed.
Use Cases and Future Work
Once our plugin was complete, we started to use it for interesting queries at Rockset. One thing we started out looking at was our internal GitHub metrics. Specifically, we started looking at the number of open issues every hour, the number of closed issues and the number of files added or modified across the course of a day in our company.
We also began tracking metrics like the number of Kubernetes events in our dev cluster for better understanding outages and usage spikes.
These queries are just a few examples of how Rockset can be used with Grafana to provide realtime insights into arbitrary collections of data, and we’re excited to roll this plugin out more widely and see how our customers use it. To see a more detailed view of the plugin and to get started using it, check out the documentation.

Posted on September 20, 2019
Join Our Newsletter. No Spam, Only the good stuff.
Sign up to receive the latest update from our blog.


