10 Tools to measure Core Web Vitals

Conti
Posted on October 14, 2021

In May 2020 Google announced Core Web Vitals as the center of how a web has to behave in front of a user, a lot has been written since then, a lot. The 3 vitals has been explained deeply all over the Internet, so I will not talk about them. Nowadays, the most important part of these metrics is how to measure and evaluate them in the most effective way, so which tools do we have at our hand to do that?
Before that I want to make sure that you really understand the difference between two concepts, Field data vs Lab data.
I am going to paste a very good explanation took from Page Speed Insights doc page:
The field data is a historical report about how a particular URL has performed, and represents anonymized performance data from users in the real-world on a variety of devices and network conditions. The lab data is based on a simulated load of a page on a single device and fixed set of network conditions. As a result, the values may differ.
So, Field data is data tracked whenever a user visits our page, could it be from a super fast PC/Mac or a slow 2G/3G connection, which will offer very different metrics. It is very good to analyze real-world user experience issues
And Lab data is basically about having some computers at google datacenter executing Lighthouse on every page. It is good for debugging performance issues and capturing tips which need deeper study.
Tools
- In browser Lighthouse
- Lighthouse cli
- LHCI
- Core Web Vitals Chrome built it extension
- Web Vitals Chrome extension
- Chrome dev tools performance
- Page Speed Insights
- Google Search console
- CrUX Dashboard
- Webpagetest
In browser Lighthouse
Local Lab data on demand, but it is not really recommended since browser extensions have great negative impact on the report results.
Lighthouse cli
Local Lab data on demand, and the only way I would recommend to execute Lighthouse, since it uses a clean Chromium window to execute the test. Check it out here
LHCI
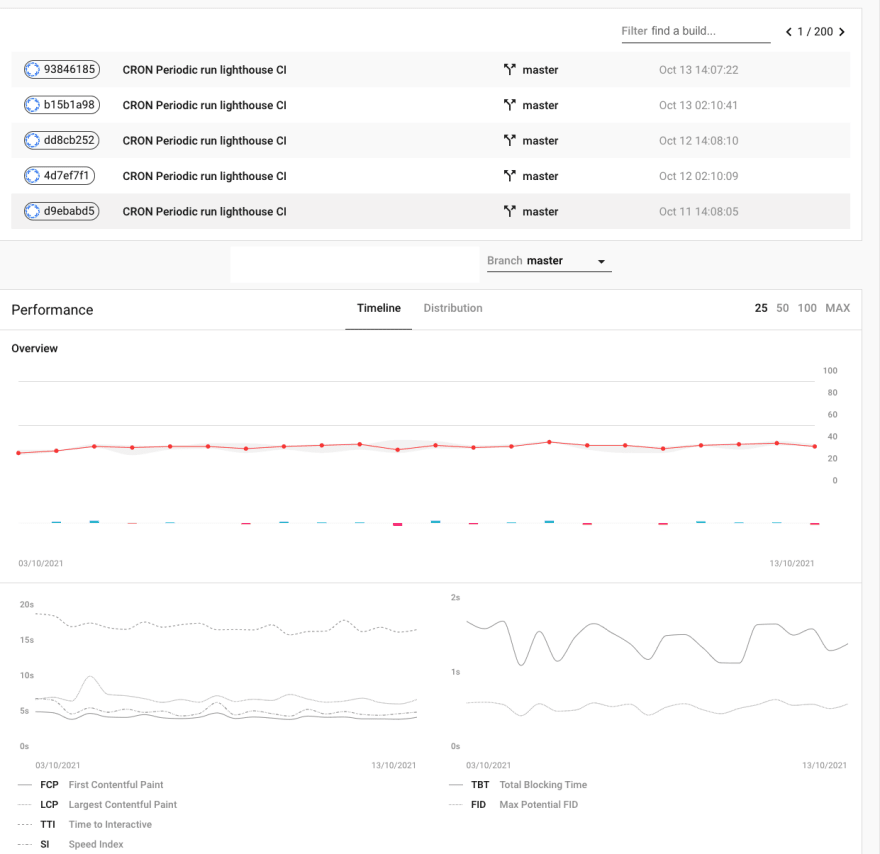
Lab data on demand and unattended. This version of Lighthouse is oriented to be integrated in a continuous integration workflow to check your metrics before deploying to production. However, you could also use it as command executed in a cron to check an environment performance over the time. I use the latter to check production performance each 12 hours, since there are third parties adding and removing dynamic content that could affect UX. Check its repo here
Core Web Vitals Chrome built it extension
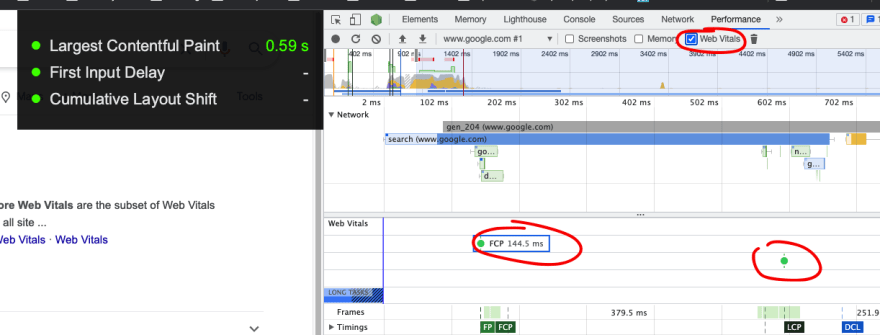
Local Field data on demand, as a native extension of Chrome browser. Very useful to detect issues in real-time. Doing a Lighthouse report after viewing this, could give you insights to solve those issues. In order to show the overlay we have two options:
a) Open Dev tools -> use Run Command option -> type "Core web vitals".
b) Keyboard shortcuts: CMD + Option + I -> CMD + SHIFT + P -> type "Core web vitals"
Web Vitals Chrome extension
Local Field data vs Field data comparison in realtime. Very useful extension since it is showing data from that moment and retrieve Field data from Chrome UX Report. You may download it from Chrome web store
Chrome dev tools performance
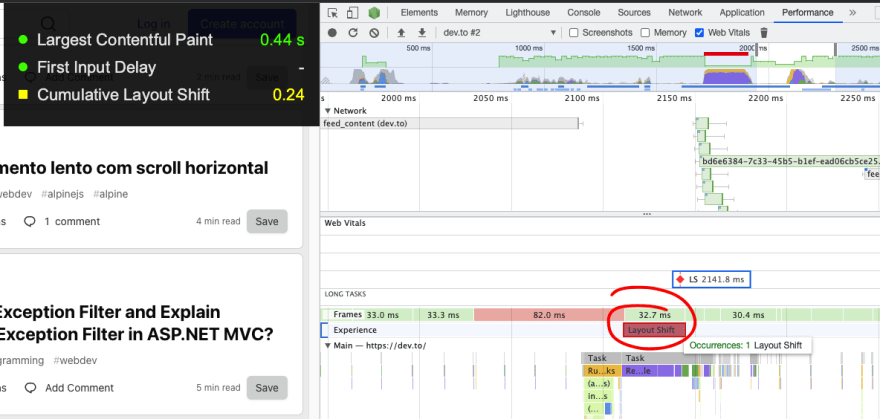
Very useful to debug possible issues related to Web Vitals, since you can check at the very right moment an issue appeared.
Page Speed Insights
This is THE tool from google to compare Field data and Lab data regarding performance scoring. It is like an empowered Lighthouse. PSI’s data is updated daily with the trailing 28-day period.
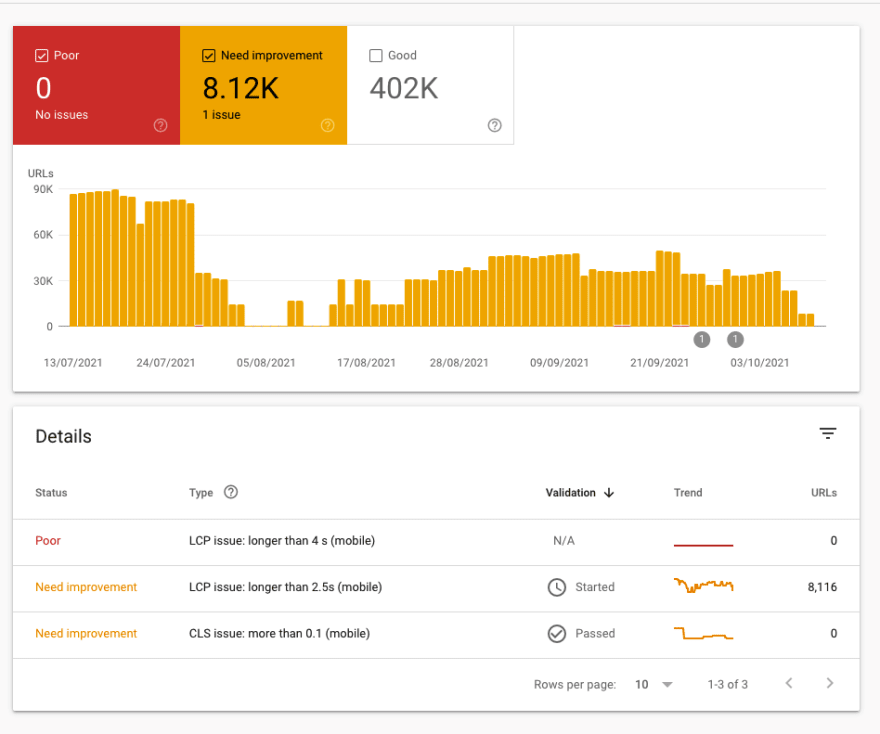
Google Search console
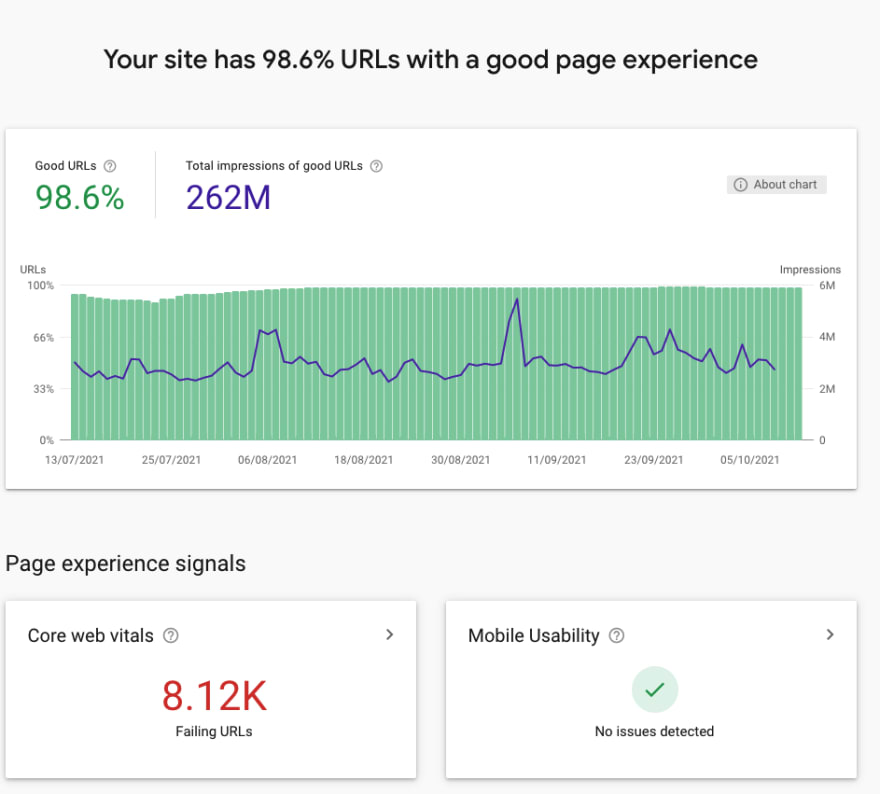
Google Search Console page experience data is fed with PSI's data, so you can easily monitor every day the trailing period and receive alerts related to Web Vitals issues.
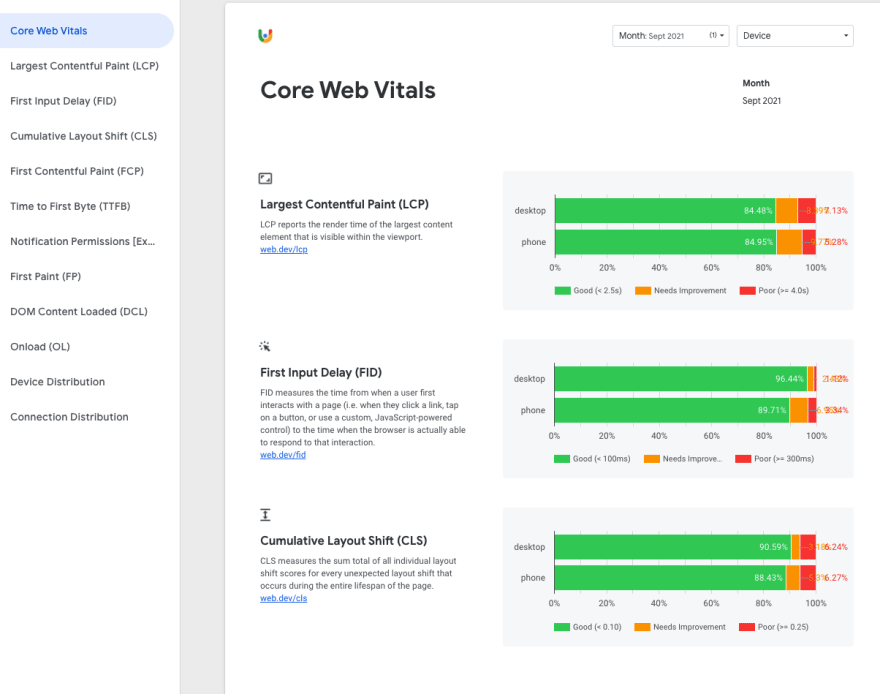
CrUX Dashboard
Building a Chrome UX Report should be one of your priorities to study Web Vitals deeply, since is going to give insights form the last month and detect trends.
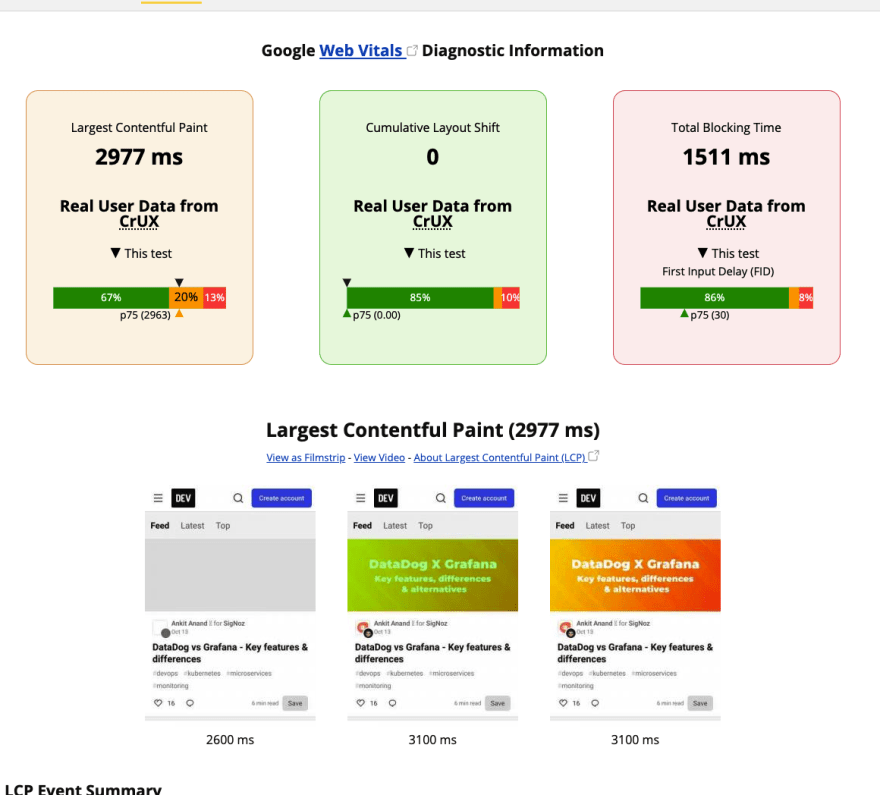
Webpagetest
Webpagetest is a long live citizen of the Internet and has been always very resourceful. It offers Web Vitals with very detailed reports with Field data and Lab data comparison, so give it a try.
I hope you enjoyed this content ;)

Posted on October 14, 2021
Join Our Newsletter. No Spam, Only the good stuff.
Sign up to receive the latest update from our blog.

