Prometheus Observability Platform: Intro

Aleksi Waldén
Posted on September 14, 2023
When a company reaches a certain size and complexity, it becomes hard to track all the metrics that the applications are generating. We can end up with teams in the company running their own observability tooling, or multiple sets of stand-alone Prometheus servers which are handled as multiple data sources in Grafana.
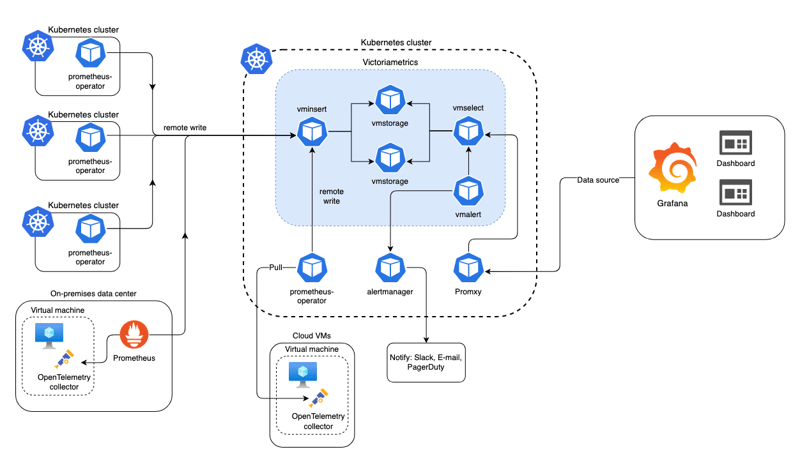
The observability platform for metrics with Prometheus (later referred to as metrics platform) is a way for all the teams and products in the company to utilise the same observability tooling for metrics-based telemetry. In short, this means that every team will send metrics to the same long-term Prometheus storage, use the same data source in Grafana when creating dashboards, and be able to set up alerts from these metrics using either Grafana alerts or Prometheus native alerts.
We want all our Prometheus servers to write their data into a long-term storage solution. If the architecture consists of multiple Kubernetes clusters, we want every cluster to have its own prometheus-operator installed and set up to send metrics.
With this centralisation, we can use a single data source to access all the metrics from all our infrastructure connected to the metrics platform. This enables creating dashboards that easily aggregate multiple Kubernetes clusters in a single panel, and allow drilling down to a single resource from the dashboard.
This series of posts will be a deep dive into the concept of a metrics platform running on Kubernetes, consisting of the following parts:
The first part of this series is a look at what a platform is. From here we will continue with setting Prometheus up on our minikube cluster, and leveraging VictoriaMetrics as our long-term storage system. We will set up alerts using Prometheus alerting syntax and use promtool to run unit tests on them. We will then continue setting up vmalert as our alert handling component and send alerts to Alertmanager. Then we will use Promxy to handle situations involving multiple Kubernetes clusters in multiple regions. We will set up a custom app in our cluster and use Prometheus ServiceMonitor to pick up its metrics. Lastly, we will set up Grafana to use a single data source to access all the metrics from our whole platform.
Links to each part of this series:
- Prometheus Observability Platform: Platform
- Prometheus Observability Platform: Prometheus
- Prometheus Observability Platform: Long-term storage
- Prometheus Observability Platform: Alerts
- Prometheus Observability Platform: Alert routing
- Prometheus Observability Platform: Handling multiple regions
- Prometheus Observability Platform: Application metrics
- Prometheus Observability Platform: Grafana

Posted on September 14, 2023
Join Our Newsletter. No Spam, Only the good stuff.
Sign up to receive the latest update from our blog.
