Observability with OpenTelemetry, Jaeger and Rails

Ademar Tutor
Posted on February 22, 2024

In a traditional monolithic architecture, the application's behavior is relatively straightforward because all components reside within a single process. You can easily trace requests from their entry to their exit points.
However, in a microservices architecture, a single transaction or request might pass through many services hosted on different machines or across different data centers. This dispersion makes it hard to "observe."
Does it apply to a Rails monolith?
Yes, it does!
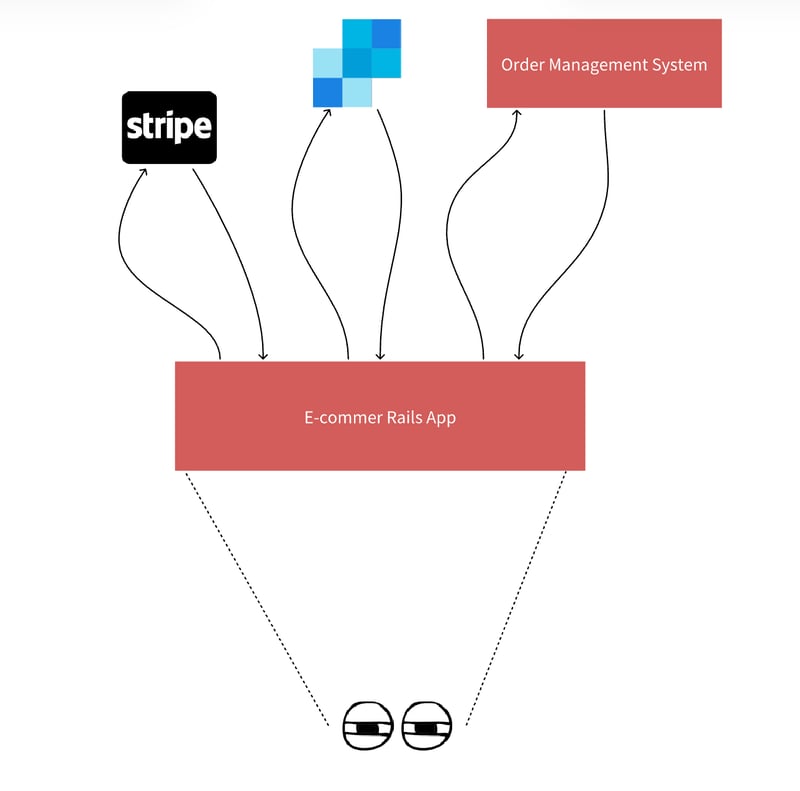
Let's say you are working on an e-commerce application. You are fixing a production bug for the checkout workflow on this application.
The workflow includes the following actions:
Charging credit cards via a 3rd party payment gateway (Stripe, Braintree and etc.)
Sending a customer an email notification (Sendgrid, Twilio)
Send updates to your order management system responsible for handling your inventory.
The bug only arises during peak hours.
This would only mean that one or two of the processes took too long to respond and caused the entire workflow to fail.
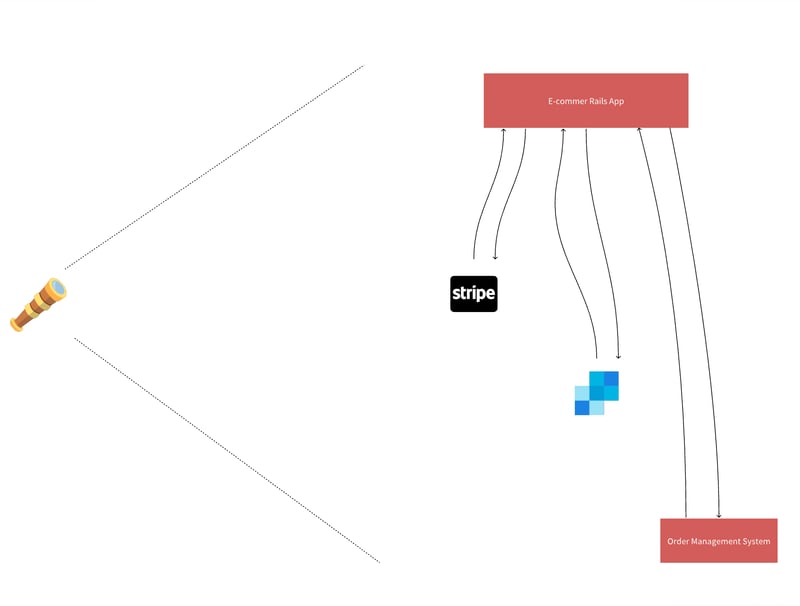
You do not monitor your Rails application's internal components, but you must also monitor the interactions with these external services.
This is where OpenTelemetry comes in.
What is OpenTelemetry?
OpenTelemetry is an open-source observability framework that helps you gather metrics, traces, and logs.
Why do I need that? I already have New Relic, Skylight, and AppSignal.
OpenTelemetry is vendor-neutral. It doesn't lock you into a specific observability platform. You can switch to another vendor. Plus, OpenTelemetry is incubated by CNCF and is supported by industry leaders. This means it's here to stay!
Would OpenTelemetry replace New Relic, Skylight, and AppSignal?
OpenTelemetry specifies how data should be structured, collected, and sent over the network, but it doesn't provide a backend system to store, visualize, or analyze this data.
You can send this data to New Relic or AppSignal to store, visualize, or analyze.
But you can set up open-source solutions to view your data. This is where Jaeger comes in.
Jaeger maps the flow of requests and data as they traverse a distributed system. These requests may make calls to multiple services, which may introduce their own delays or errors.
https://www.jaegertracing.io/
How do you set up OpenTelemetry + Jaeger with a Ruby on Rails application?
These are the step-by-step process for integrating OpenTelemetry and Jaeger with your Ruby on Rails app.
1) Install the necessary gems
gem "opentelemetry-sdk"
gem "opentelemetry-exporter-otlp"
gem "opentelemetry-instrumentation-all"
2) Run Rails app and set the tracer exporter to console.
env OTEL_TRACES_EXPORTER=console rails server
Now, see if you can see the logs on the server. The logs should show something like this:
3) You can then set up a Jaeger backend to pass data. You can do that by running this image on your terminal:
docker run -d --name jaeger \
  -e COLLECTOR_ZIPKIN_HOST_PORT=:9411 \
  -p 5775:5775/udp \
  -p 6831:6831/udp \
  -p 6832:6832/udp \
  -p 5778:5778 \
  -p 16686:16686 \
  -p 14268:14268 \
  -p 14250:14250 \
  -p 9411:9411 \
  jaegertracing/all-in-one:latest
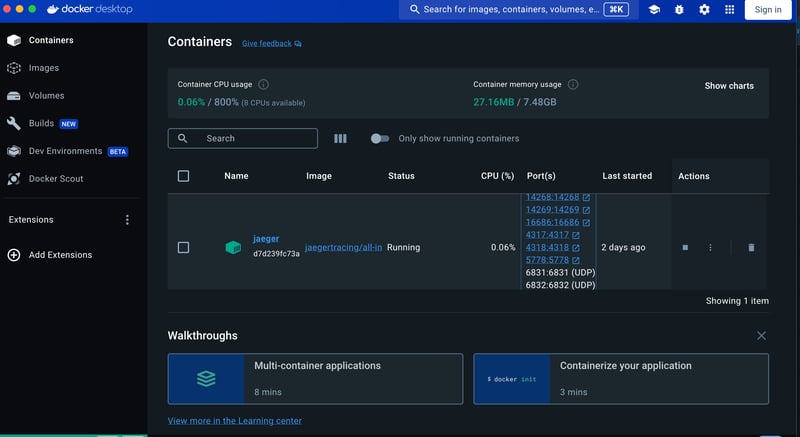
You will see the Jaeger on your docker desktop. You need to make sure the container is running.
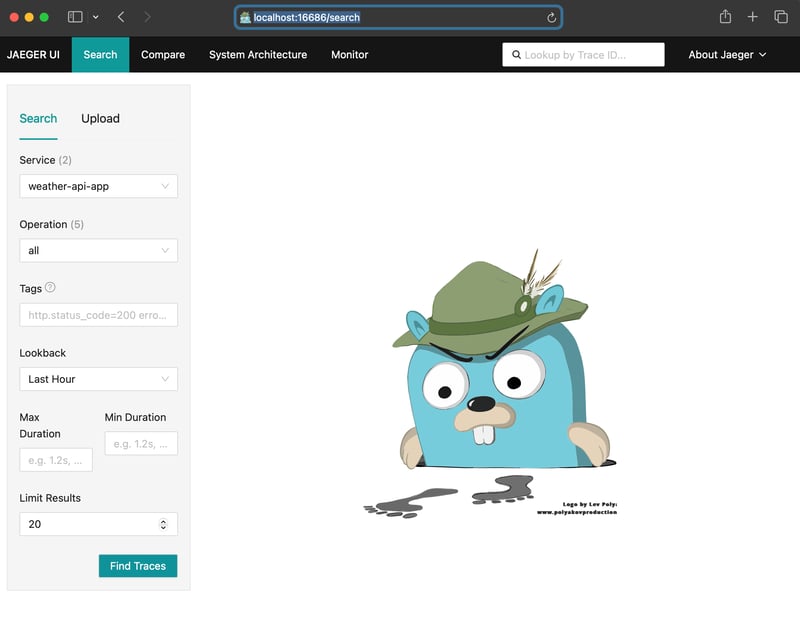
Once it's running you should be able to access the Jaeger UI on your browser via http://localhost:16686/search
By default, traces are sent to an OTLP endpoint listening on localhost:4318. Your rails app should be set up automatically. However, if you need to update the endpoint, you can set it up manually by adding an ENV variable.
env OTEL_EXPORTER_OTLP_ENDPOINT="http://localhost:4318" rails server
You should be able to see the request on Jaeger UI:
Originally posted on: https://blog.ademartutor.com/p/observability-with-opentelemetry
Hello there!
Do you have a startup idea or an exciting project you're passionate about? I'd love to bring your vision to life!
I'm a software developer with 13 years of experience in building apps for startups, I specialize in Rails + Hotwire/React.
Whether you're looking to innovate, grow your business, or bring a creative idea to the forefront, I'm here to provide tailored solutions that meet your unique needs.
Let's collaborate to make something amazing!
Sincerely,
Ademar Tutor
hey@ademartutor.com

Posted on February 22, 2024
Join Our Newsletter. No Spam, Only the good stuff.
Sign up to receive the latest update from our blog.


