What I Found When I Went Through My Facebook Location Data

Haseeb
Posted on May 31, 2019
Some visualizations and stats on my facebook location data and the results, well you could say are not very pleasant.
For some time Facebook has been allowing users to download the data it has on them, so one curious night I went ahead and downloaded all of my location data that Facebook has.
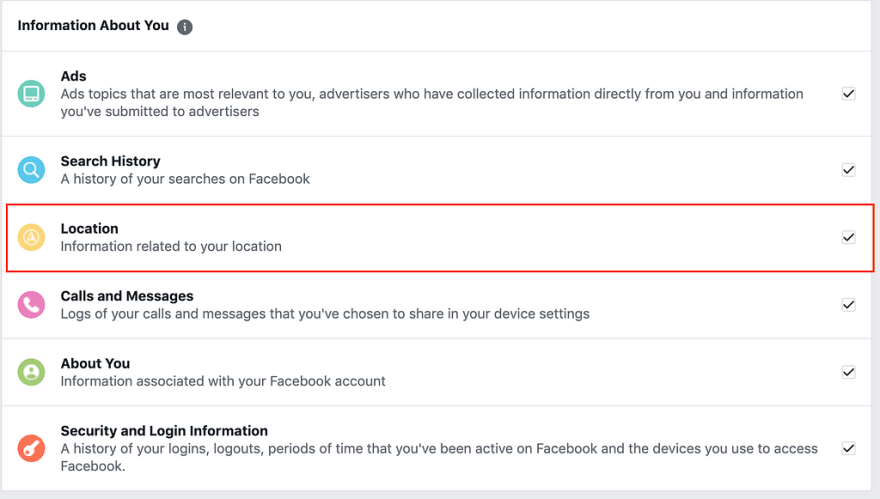
Facebook allows you to download your data as browser viewable HTML, but that view isn’t really interesting and doesn’t reveal much (as Facebook would probably want 🤷♂️). The HTML view just gives you a boring list of coordinates like this.
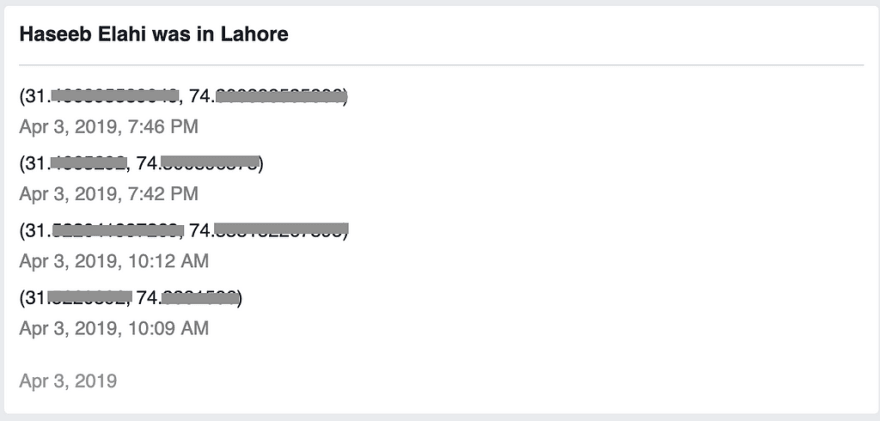
I downloaded the data in JSON which is another of the supported formats and did some basic stats & visualizations.
I have been a Facebook user since 2011 but started using the Facebook app on my phone 3–4 years later. All of the stats and visualizations here are from location data ranging from January 2015–April 2019.
Number of Times Facebook Stored My Location
Facebook accessed and stored my location for a total of 2818 times in the period from start of 2015 to April of 2019 averaging almost 650 times a year , 54 times a month 🙀 or twice every day 😮. When you think about these numbers for a moment, it almost feels like basically being tracked literally all the time!
Stored Locations By Year
Facebook’s location collection seems to be tied with how often your location changes and obviously having your phone’s location turned on is a prerequisite. This graph shows a trend of location entries by each year.
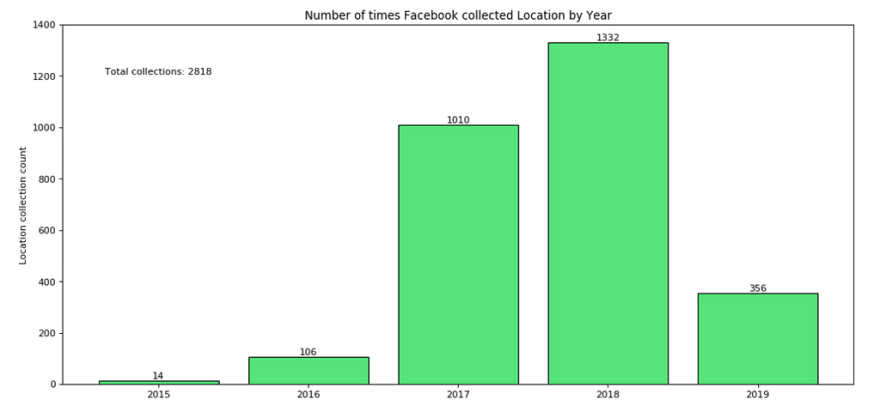
The reason for the huge spike in data collection from 2016 to 2017 is maybe due to some change in Facebook’s location collection policy or probably I just bought a good smartphone in 2017 and started having the location turned on all the time on my Android smartphone.
Busiest Location Collection Days
Digging deeper into the data, I went ahead and filtered out the ten days which had the highest location collection frequency. Can you guess how many times at maximum my location got stored on Facebook on any given day?
50, 100? Nope, Two Hundred and Thirty-Eight times!
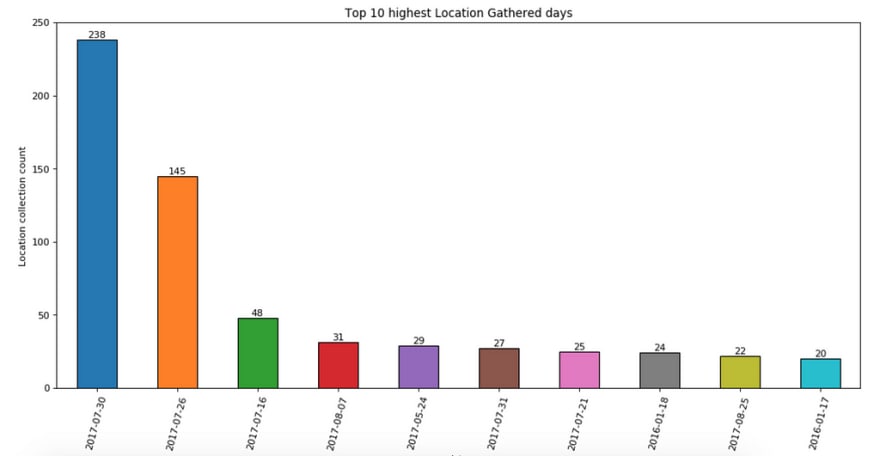
Turns out I was traveling on that particular day and was on the road for the most part of my day and Facebook like any worried parent would do, checked on me for 238 times…
What would all of this data look like on a map?
Naturally I wanted to put all of this latitude and longitude data on an actual map to visualize where I have been moving around in all these years!
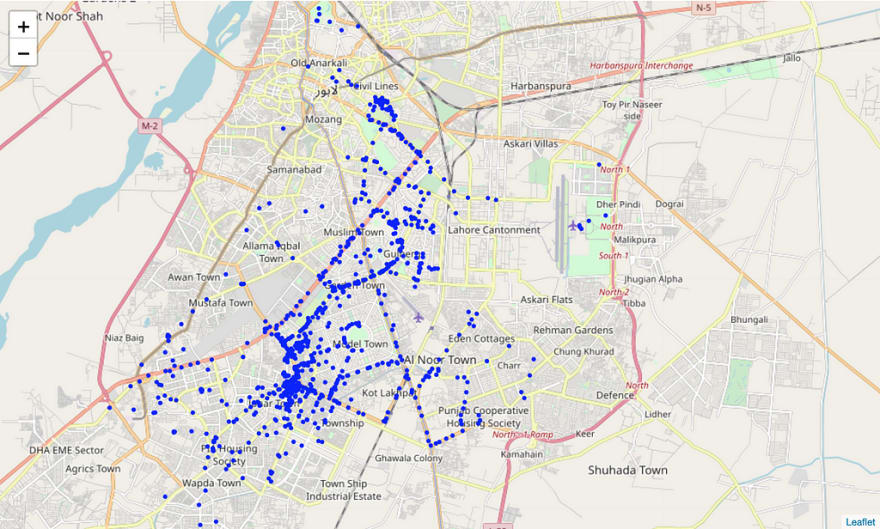
So this above is a visual representation of my location data that Facebook has almost in a 15km radius of my house in my hometown (Lahore, PK). Each blue dot represents one instance of a location captured and stored by Facebook.
For some of the locations marked here I didn’t even remember visiting that area but thanks to Facebook for providing hard evidence I recalled _everywhere I’ve been in the past 4 years _ 🙃
With the location data, timings for each location capture and Facebook’s resources it is very easy to infer any Facebook app user’s home address, workplace, where do they go on weekends regularly, which restaurants they eat at and so on. All of this definitely makes targeting ads easier and of course classifying specific user personas for political and social purposes.
Considering the latest speculation about Facebook launching a dating service of their own, this data could be of a lot more use in “👫 bringing people together”!
So, next time when you meet someone and the next thing is that they start appearing in your ‘Suggested Friends’ list don’t get surprised 😆
You can find detailed analysis on my Facebook data here on Kaggle
https://www.kaggle.com/helahi/facebook-messages-analysis
Thank you for making it through! If you think I should dig in some more into this data to find any other stats or patterns, let me know in the comments!

Posted on May 31, 2019
Join Our Newsletter. No Spam, Only the good stuff.
Sign up to receive the latest update from our blog.