fast and simple data presentation for non-frontend developers

Barbara
Posted on September 24, 2021

When you are working as a backend developer, data engineer, scientist or analyst you normally don't have to work with the glorious frontend trio html, css and js. But sometimes you need them to set up a simple webpage to present your data.
What you need, is fetching some data and display them in some divs. Sounds easy. But when you are on it, you often realise, that it is not that simple if this is not your daily business. Have no fear, help is near. This little guidance is ment for everyone, so that everyone can simply display data within an .html file without any pain or spending ours googling frontend questions.
Create the files
For better structuring it is recommended to store markup, styles and javascript in separate files. If you have very little code, you can keep it in one .html
Create an main.html, main.js and a main.css in one folder.
The link for the stylesheet is placed in the within the<head>. The js is placed within the <script> at the end of the <body>. This is done, to allow the html to be loaded faster and execute possible javascript manipulations when the DOM is already loaded.
<!DOCTYPE html>
<html lang="en">

 <head>
  <meta charset="UTF-8">
  <meta name="viewport" content="width=device-width, initial- scale=1.0">
  <title>Your title, displayed in the tab</title>
  <link rel="stylesheet" href="main.css">
 </head>
 <body>
  <header>CATS</header>
  <div id="facts">
   <!-- facts content will be placed here -->
  </div>
  <div class="main-container">
   <!-- all the breeds will be placed here -->
  <div>
  <script src="main.js"></script>
 </body>
</html>
Fetch data using a web API
We can use the Fetch API as an application programming interface for the Web.
If you have not done yet, create a main.js file to place your js there.
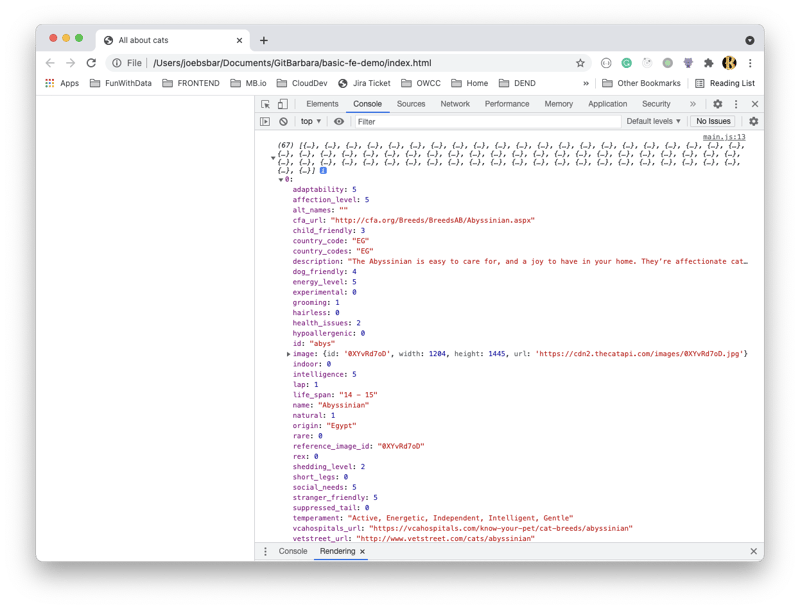
For this example I will use mock data from the awesome https://thecatapi.com/. The request above returns us all breeds. For now we are only logging the received data. You can have a first look, to check if your data is correct.
const url = "https://api.thecatapi.com/v1/breeds/";
fetch(url, {
  method: "GET",
  withCredentials: true,
  headers: {
    "X-API-KEY": "your-api-key",
    "Accept": "application/json",
    "Content-Type": "application/json"
  }
})
.then(resp => resp.json())
.then(function(data) {
 console.log('received data:', data);
})
.catch(function(error) {
 console.log(error);
});
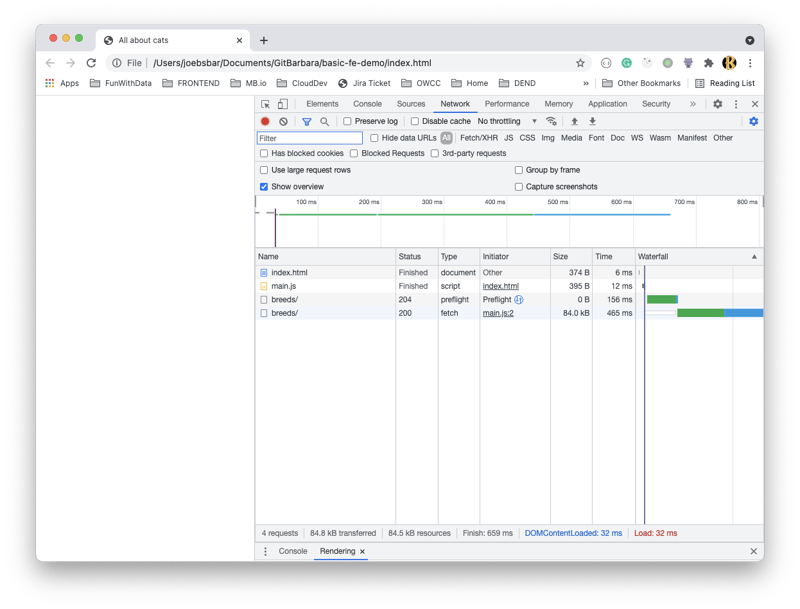
To do so open the network tab in the developer tools of your chrome browser - ⌘⌥I on mac. Now you can double click on the request to see the data in a browser tab. Therefore I would recommend using a JSON Formatter like this to increase readability. As we log the data you can also see it in the console tab.
Create the markup and the data via javascript
Once that data is correctly loaded, we can add some functions to get some insights about our cats breeds.
First we want to know some facts about our cats. How many breeds are there in total and from how many countries. Once we have calculated the numbers, we want to render them with the help of template literals.
const facts =  document.getElementById('.facts');

function createMainStats(breeds) {
 const numberOfBreeds = breeds.length;
 const numberOfUniqueCountries =  [...new Set(breeds.map(breed => breed?.country_code))]

 this.facts.innerHTML = `There are ${numberOfBreeds} breeds from ${numberOfUniqueCountries.length} countries.`;
}
We want to put the data of every breed into div and render it into the mainContainer. Therefore we create the createBreedCards(). With the help of the map functionality, we can loop over the breeds array and return a div with content for every breed. To output the data we use template literals. We put the data into ${value} and the browser replaces the expression automatically with the real value.
Do prevent pain with missing properties, we use the optional chaining operator ?. This will return undefined instead of an error if a property does not exist.
const mainContainer = document.getElementById('.mainContainer');

function createBreedCards(data) {
    const breedCards = data.map(breed => {
        return `
            <div class="breed-card">
                <h3>${breed?.name}</h3>
                <img src="${breed?.image?.url}"/>
                <a href="${breed?.wikipedia_url}" target="_blank">more information</a>
            </div>
            `;
    }).join('');

    this.mainContainer.innerHTML = breedCards;
}
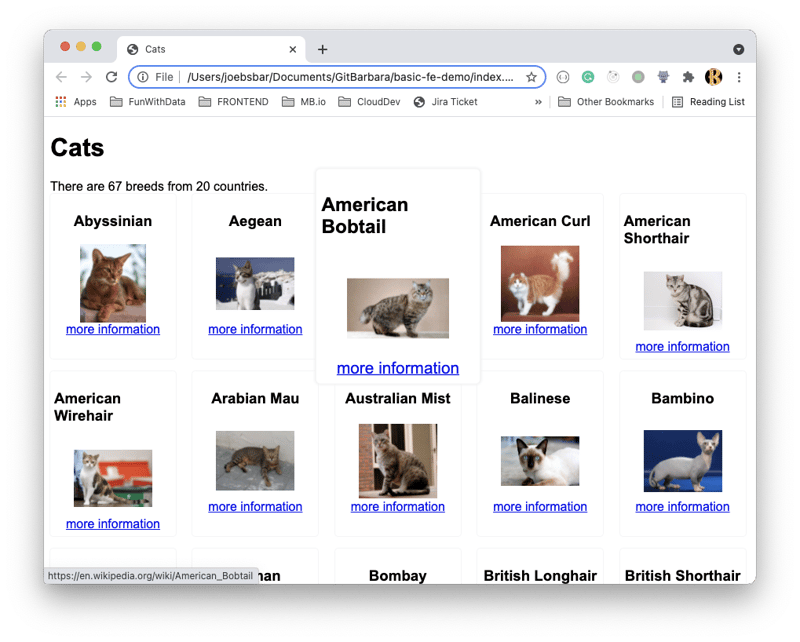
Now we have all cards rendered. It still looks a somehow broken, but the data is there.
Now we can add some styling to the cards. And thanks to css flex centering things is not an issue anymore.
.breed-card {
    border: 1px solid white;
    background-color: white;
    border-radius: 4px;
    box-shadow: 0 0 1px 1px #f4f4f4;
    padding: 4px;
    width: 150px;
    height: 200px;
    display: flex;
    flex-direction: column;
    align-items: center;
}

.breed-card:hover {
    transform: scale(1.3);
    cursor: pointer;
    box-shadow: 0 0 2px 2px #f4f4f4;
}
All cards are rendered one beneath another. This uses a lot of space. To render them in a grid, we use css grid.
#mainContainer {
    max-width: 1200px;
    margin: 0 auto;
    display: grid;
    grid-template-columns: repeat(5, 1fr);
    grid-gap: 1rem;
}
This will place 5 card elements in a row, with a given responsive gap.
Done
The data is now rendered in a card layout. No libraries or build tools needed for a simple presentation of data. The demo files can be found here.

Posted on September 24, 2021
Join Our Newsletter. No Spam, Only the good stuff.
Sign up to receive the latest update from our blog.


