Using free tools to optimise a serverless application

Matt Lewis
Posted on August 3, 2020

Introduction
I've recently been building out a serverless application on AWS that interacts with Amazon QLDB as a purpose-built database at the backend. In many cases, making a few simple configuration changes can have a dramatic impact on performance. This post looks at some free tools and services that you can use to help optimise your own serverless application. For demonstration purposes, I focus on QLDB but also detail a brief comparison with DynamoDB.
The following tools are used:
- Artillery to generate load
- Faker to generate fake data
- Serverless Webpack to bundle modules
- Lumigo CLI which provides a collection of helpful commands
- AWS Lambda Power Tuning for optimal Lambda configuration
- CloudWatch Log Insights to query data in log groups
- AWS X-Ray for analysing service calls
The QLDB Perf Test GitHub repositority contains the code used for these tests.
Architecture
The performance test demo application has the following architecture:
It is configured using Serverless Framework to ensure everything is managed as code in one CloudFormation stack, and can be deployed or removed at any time.
Deploy
To deploy the stack run the following command:
sls deploy
The resources section in the serverless.yml file contains raw CloudFormation template syntax. This allows you to create the DynamoDB table as well as attributes that describe the key schema for the table and indexes, and those that make up the primary key. QLDB is completely schemaless, and there is no CloudFormation support to create tables or indexes. This can be done using a custom resource. However, for this test I just logged into the console and ran the following PartiQL commands:
CREATE TABLE Person
CREATE INDEX ON Person (GovId)
Create Test Data
The next step is to create test data using Faker and Artillery. The first step is to create a simple artillery script for adding a new Person to the table in QLDB (and a separate script for DynamoDB). The script itself is shown below:
config:
    target: "{url}"
    phases:
      - duration: 300
        arrivalRate: 10
    processor: "./createTestPerson.js"

scenarios:
    - flow:
        # call createTestPerson() to create variables
        - function: "createTestPerson"
        - post:
            url: "/qldb/"
            json:
                GovId: "{{ govid }}"
                FirstName: "{{ firstName }}"
                LastName: "{{ lastName }}"
                DOB: "{{ dob }}"
                GovIdType: "{{ govIdType }}"
                Address: "{{ address }}"
The config section defines the target. This is the URL returned as part of deploying the stack. The config.phases allows more sophisticated load phases to be defined, but I went for a simple test where 10 virtual users are created every second for a total of 5 minutes. The config.processor attribute points to the JavaScript file to run custom code.
The scenarios section defines what the virtual users created by Artillery will be doing. In the case above, it makes an HTTP POST with the JSON body populated using variables retrieved from the createTestPerson function. This is a module that is exported in the JavaScript file that looks as follows:
function createTestPerson(userContext, events, done) {
  // generate data with Faker:
  const firstName = `${Faker.name.firstName()}`;
  ...
  // add variables to virtual user's context:
  userContext.vars.firstName = firstName;
  ...
  return done();
}

module.exports = {
  createTestPerson
};
In the git repository, the following scripts have been defined:
- create-qldb-person.yml
- create-dynamodb-person.yml
- get-qldb-person.yml
- get-dynamodb-person.yml
There are also some node scripts that can be run locally to populate a CSV file that is used for load test enquiries. These can be run using the following commands:
node getQLDBPerson > qldbusers.csv
node getDynamoDBPerson > dynamodbusers.csv
Run a baseline test
To start off with, I ran a baseline test creating 3000 new records in a 5 minute period using the following command:
artillery run create-qldb-person.yml
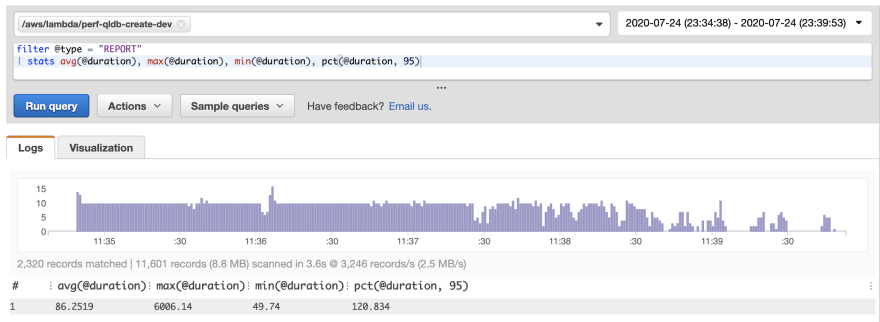
The output tells me that the records were created successfully, but nothing around the performance. Luckily, all Lambda functions report metrics through Amazon CloudWatch. Each invocation of a Lambda function provides details about the actual duration, billed duration, and amount of memory used. You can quickly create a report on this using CloudWatch Log Insights. The following is the query I ran in Log Insights, followed by the resulting report that was created:
filter @type = "REPORT"
| stats avg(@duration), max(@duration), min(@duration), pct(@duration, 95)
Running the baseline test querying data produced broadly similar results:
Enable HTTP Keep Alive
The first optimisation using Nodejs is to explicitly enable keep-alive. This can be done across all functions using the following environment variable:
environment:
    AWS_NODEJS_CONNECTION_REUSE_ENABLED : "1"
This was first written up by Yan Cui, and appears to be unique to the AWS SDK for Node, which creates a new TCP connection each time by default.
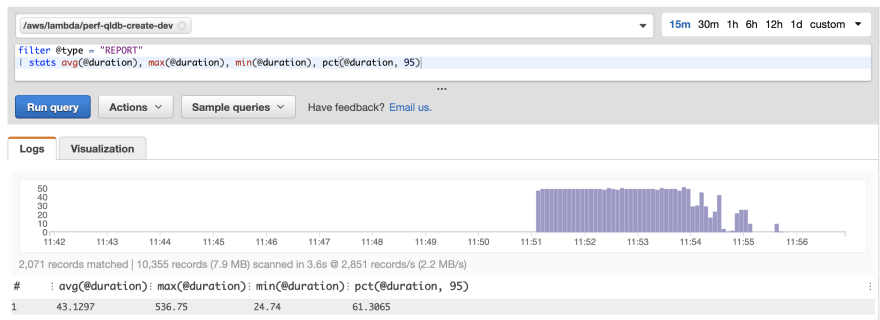
Running the tests again, saw a significant performance improvement:
The average response time has roughly halved. This is also true for the P95 value. For these requests, it also halves the cost of the lambda invocation. This is because lambda pricing is charged per 100ms.
Build functions using Webpack
The next optimisation is to look at the cold start times. When the stack was first deployed, we see the size of the artefact output when running sls deploy:
Serverless: Uploading service qldb-perf-demo.zip file to S3 (10.18 MB)...
Another brilliant tool is the lumigo-cli. This has a command that can be run to analyse the lambda cold start times. I ran this command to analyse all cold starts for a specific lambda function in the last 30 minutes:
lumigo-cli analyze-lambda-cold-starts -m 30 -n perf-qldb-get-dev -r eu-west-1
This produced the following output:
To optimise cold start times, I used webpack as a static module bundler for JavaScript. This works by going through your package and creating a new dependency graph, which pulls out only the modules that are required. It then creates a new package consisting of only these files. This tree shaking can result in a significantly reduced package size. A cold start for a lambda function involves downloading the deployment package and unpacking it ahead of invocation. A reduced package size can result in a smaller cold start duration.
I used the serverless-webpack plugin and added the following to the serverless.yml file:
custom:
  webpack:
    webpackConfig: 'webpack.config.js'
    includeModules: false
    packager: 'npm'
I then created the webpack.config.js file specifying the entry points of the lambda functions:
module.exports = {
  entry: {
    'functions/perf-qldb-create': './functions/perf-qldb-create.js',
    'functions/perf-qldb-get': './functions/perf-qldb-get.js',
    'functions/perf-dynamodb-create': './functions/perf-dynamodb-create.js',
    'functions/perf-dynamodb-get': './functions/perf-dynamodb-get.js',
  },
  mode: 'production',
  target: 'node'
}
The impact of bundling the deployment package using webpack could be seen when redeploying the stack:
Serverless: Uploading service qldb-perf-demo.zip file to S3 (1.91 MB)...
With minimal effort we have reduced the package size by over 80%. Re-running load tests and using the lumigo-cli to analyse the cold starts resulted in the following:
This resulted in a 200ms reduction in initialisation durations for cold starts, a decrease of 40%.
Optimise Lambda configuration
The final check was using the amazing AWS Lambda Power Tuning open-source tool by Alex Casalboni. This uses Step Functions in your account to test out different memory/power configurations. This requires an event payload to pass in. I used the following log statement to print out the event message of an incoming request in the lambda function.
console.log(`** PRINT MSG: ${JSON.stringify(event, null, 2)}`);
I then copied the event message into a file called qldb-data.json, and ran the following command:
lumigo-cli powertune-lambda -f qldb-data.json -n perf-qldb-get-dev -o qldb-output.json -r eu-west-1 -s balanced
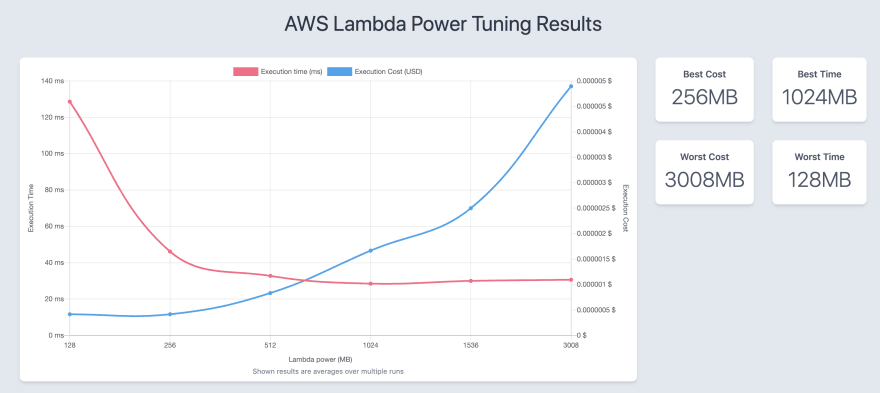
This generated the following visualisation:
In this case, having a memory allocation of 512MB works best in terms of the trade off between cost and performance.
DynamoDB Comparison
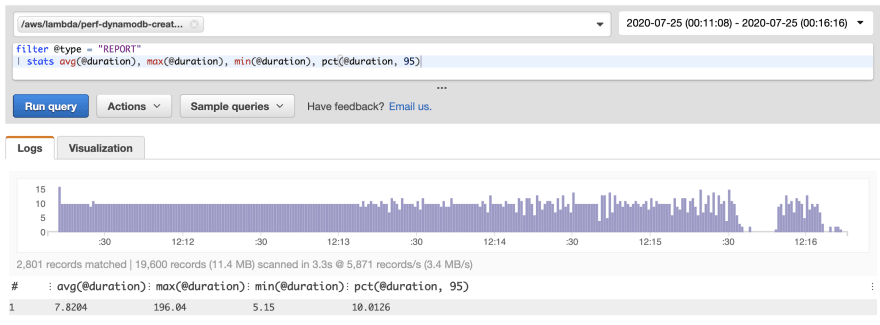
The same tools were used on DynamoDB to optimise the out of the box performance, with similar improvements. The striking difference is that the average latency for both creates and gets were single digit millisecond as shown below:
It was also noticeable that the average cold start time (though with a minimal data set) was around 40% less than that of QLDB.
With some services, there are also additional metrics that can be analysed. For example, DynamoDB has an extensive set of metrics available to view in the console such as read and write capacity, throttled requests and events and latency. Using tools such as Artillery in combination with Faker gives access to these metrics that can help further optimise performance. The following chart shows the write capacity units consumed by DynamoDB for the 5 minutes of one of the test runs.
But before drawing a conclusion, it's also worth understanding what is happening during a service call, using another tool called AWS X-Ray.
AWS X-Ray
AWS X-Ray is used to trace requests through an application. To trace the latency for AWS service, the X-Ray SDK can be auto-instrumented with a single line:
const AWSXRay = require('aws-xray-sdk-core');
const AWS = AWSXRay.captureAWS(require('aws-sdk'));
Traced AWS services and resources that you access appear as downstream nodes on the service map in the X-Ray console. The service map for the lambda function that gets data from QLDB is shown below:
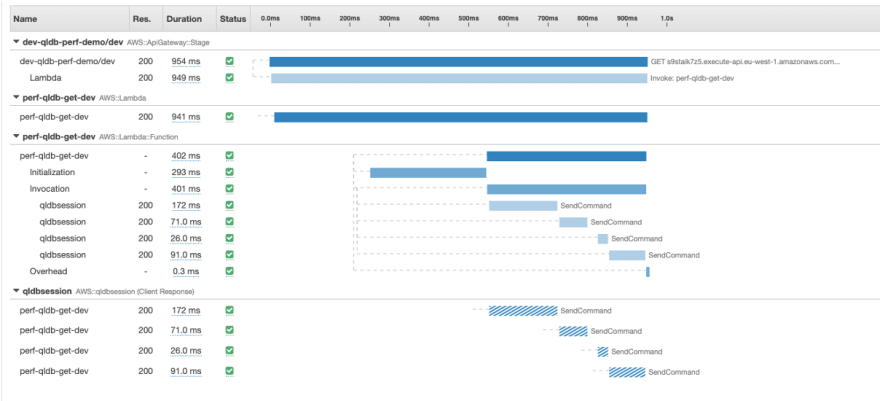
The most striking observation is that each request results in 4 invocations to the QLDB Session object. You can see this in more detail by analysing the trace details of individual requests. The one below is chosen as it shows not only the 4 SendCommand calls, but the Initialization value shows that this was a cold start.
All interaction with QLDB is carried out using the QLDB driver, which provides a high-level abstraction layer above the QLDB Session data plane and manages the SendCommand API calls for you. This includes the necessary SendCommand calls to StartTransaction, ExecuteStatement and CommitTransaction. This is because QLDB Transactions are ACID compliant and have full serializability - the highest level of isolation. QLDB itself is implemented with a journal-first architecture, where no record can be updated without going through the journal first, and the journal only contains committed transactions.
At any point in time, you can export the journal blocks of your ledger to S3. An example of a journal block taken when I exported the ledger is shown below:
{
    blockAddress: {
        strandId:"Djg2uUFY81k7RF3W6Kjk0Q",
        sequenceNo:34494
    },
    transactionId:"BvtWxFcAprL46H8SUO4UNB",
    blockTimestamp:2020-07-29T14:36:46.878Z,
    blockHash:{{VWrBpXNsFqrakqlyqCYIQA85fVihifAC8n4NjRHQF1c=}},
    entriesHash:{{dNkwEyOukyqquu0qGN1Va+M/wZoM6ydpeVym2SjPYHQ=}},
    previousBlockHash:{{ZjoCeXoOtZe/APVp2jAuKILnzPfXNIIDxAW8BHQ6L0g=}},
    entriesHashList:[{{f+ABhLyvVPWxQpTUIdCInfBxf/VeYUAqXgfbhVLn/hI=}},
    {{}},
    {{ExVOMej9pEys3rU1MEZyNtHaSSt5KnaFvFQYL3qPO2w=}}],
    transactionInfo: {
        statements:[{
            statement:"SELECT * FROM Person AS b WHERE b.GovId = ?",
            startTime:2020-07-29T14:36:46.814Z,
            statementDigest:{{scNEggVYz4buMxYEBvIhYF8N23+0p2huMD37bCaoKjE=}}
        }]
    }
}
{
    blockAddress: {
        strandId:"Djg2uUFY81k7RF3W6Kjk0Q",
        sequenceNo:34495
    },
    transactionId:"IyNXk5JJyb5L8zFYifJ7lu",
    blockTimestamp:2020-07-29T14:36:46.879Z,
    blockHash:{{QW6OILb/v7jwHtPhCxj4bh0pLlwL7PqNKfi7AmNZntE=}},
    ...
This shows that even when carrying out a select statement against the ledger, it takes place within a transaction, and the details of that transaction are committed as a new journal block. There are no document revisions associated with the block, as no data has been updated. The sequence number that specifies the location of the block is incremented. As a transaction is committed, a SHA-256 hash is calculated and stored as part of the block. Each time a new block is added, the hash for that block is combined with the hash of the previous block (hash chaining).
Conclusion
This post has shown how to use some free tools and services to optimise your serverless applications. From the baseline test for interacting with QLDB, we have:
- Reduced average response times by ~50%
- Reduced cold start overhead by ~40%
- Reduced package size by ~80%
- Chosen the most appropriate memory size for our Lambda functions
We have ended up with inserts and queries to QLDB responding in around 40ms. This also provides us with fully serializable transaction support, a guarantee that only committed data exists in the journal, immutable data, and the ability to crytographically verify the state of a record going back to any point in time to meet audit and compliance requirements. All of this is provided out of the box with a fully schemaless and serverless database engine, and we had no need to configure our own VPCs.
The use of DynamoDB in this post was to demonstrate how the tools will work for optimising Lamda functions interacting with any service. However, it also highlights that it is important to choose the right service to meet your requirements. QLDB is not designed to provide the single-digit millisecond latency that DynamoDB can. But, if you do have complex requirements that cover both audit and compliance and maintaining a source of truth, as well as supporting low latency reads and complex searches, you can always stream data from QLDB into other purpose built databases as I show in this blog post

Posted on August 3, 2020
Join Our Newsletter. No Spam, Only the good stuff.
Sign up to receive the latest update from our blog.

