SLOs with Stackdriver Service Monitoring

Yuri Grinshteyn
Posted on January 7, 2020
Service Level Objectives or SLOs are one of the fundamental principles of site reliability engineering. We use them to precisely quantify the reliability target we want to achieve in our service. We also use their inverse, error budgets, to make informed decisions about how much risk we can take on at any given time. This lets us determine, for example, whether we can go ahead with a push to production or infrastructure upgrade.
However, Stackdriver has never given us the ability to actually create, track, alert, and report on SLOs - until now. The Service Monitoring API was released to public beta at NEXT London in the fall, and I wanted to take the opportunity to try it out. Here's what I found.
The service
Before I could create a service level objective, I needed a service. Because the initial release of the API only supports App Engine, Istio on GKE, and Cloud Endpoints, I thought I'd try the simplest option - App Engine Standard. I created a basic Hello World app in Go using the Mux router - here's the code for it:
package main

import (
    "fmt"
    "net/http"

    "github.com/gorilla/mux"
)

func main() {
    r := mux.NewRouter()

    r.HandleFunc("/", func(w http.ResponseWriter, r *http.Request) {
        fmt.Fprintf(w, "Hello World!")
    })

    http.ListenAndServe(":8080", r)
}
I then created the app.yaml file:
runtime: go112 # replace with go111 for Go 1.11
Next, I deployed the app using gcloud app deploy. At this point, the build process was failing, and I ended up having to follow these instructions to define a module. I am not an expert in Go, and I'm guessing that this is a matter of local environment configuration that I just couldn't be bothered to sort out. Nevertheless, I was able to deploy the app after following those instructions.
Finally, I set up a global Uptime Check to get a steady stream of traffic flowing to my new app:
Defining the SLI
Now that I had a service created, I was ready to proceed. I found the documentation on concepts very helpful, even as someone mostly familiar with this topic. For this exercise, I wanted to create a simple availability Service Level Indicator (SLI) to measure the percentage of "good" requests as a fraction of total. That required three decisions:
- How to count total requests
- How to count "good" requests
- What time frame to use for my SLI
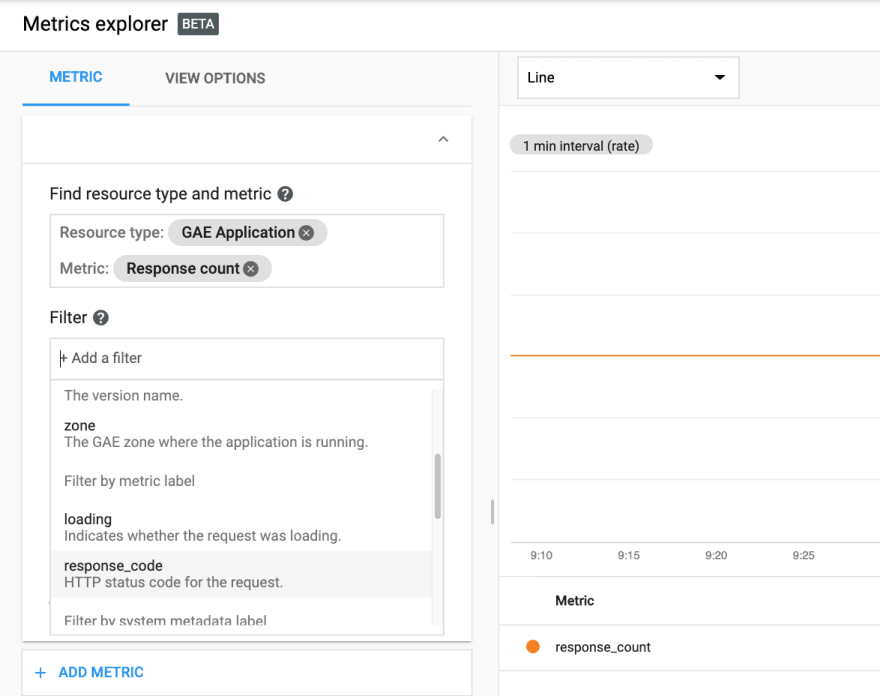
Thankfully, App Engine exposes a useful response count metric:
Note that this metric is not written if the GAE application is disabled (as I learned by attempting to simulate a failure by disabling the app).
This metric can further be filtered by response code:
I decided to use the unfiltered metric to count total requests and filter requests with a response code of 200 to count "good" requests for the sake of simplicity.
Note that this is likely far too simplistic for any production use. For example, this would count 404s as "bad" requests, when they are likely to be the result of misconfigured clients or even external scanners.
I then chose a 1 day rolling window as my SLO time frame. For a lot more information on how to choose SLIs and SLOs, I highly recommend the Art of SLOs workshop, which the Google CRE team has recently released.
Creating the SLI and SLO
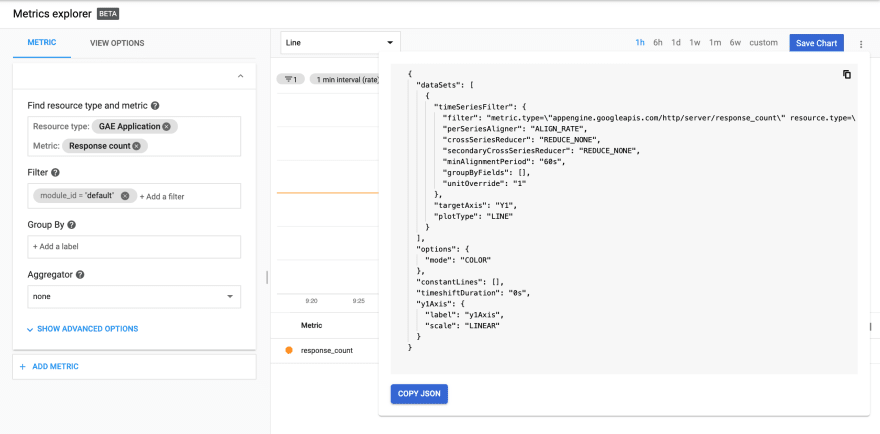
At this point, I was ready to use the API to define my SLO. As recommended in the "Building the SLI" section, I used the Metrics Explorer to create a chart that showed my "total" request count:
From there, I was able to copy the JSON for the filter:
"metric.type=\"appengine.googleapis.com/http/server/response_count\" resource.type=\"gae_app\" resource.label.\"module_id\"=\"default\""
I then modified the chart to only count the "good" requests, filtering on response_code=200 and copied that JSON:
"metric.type=\"appengine.googleapis.com/http/server/response_count\" resource.type=\"gae_app\" resource.label.\"module_id\"=\"default\" metric.label.\"response_code\"=\"200\""
At this point, I was ready to build the SLI:
  "requestBased": {
    "goodTotalRatio": {
      "totalServiceFilter": "metric.type=\"appengine.googleapis.com/http/server/response_count\" resource.type=\"gae_app\" resource.label.\"module_id\"=\"default\"",
      "goodServiceFilter": "metric.type=\"appengine.googleapis.com/http/server/response_count\" resource.type=\"gae_app\" resource.label.\"module_id\"=\"default\" metric.label.\"response_code\"=\"200\"",
    }
  }
I chose the "requestBased" type of SLI, because I was looking to capture the fraction of good over total requests. The other options include basic, which might have been good enough for my purpose here, and "window-based", which lets you count the number of periods during which the service meets a defined health threshold. I may come back and revisit the latter in another post.
From there, I defined the SLO:
{
   "displayName": "GAE Hello World Availability",
   "serviceLevelIndicator": {
      "requestBased": {
        "goodTotalRatio": {
          "totalServiceFilter": "metric.type=\"appengine.googleapis.com/http/server/response_count\" resource.type=\"gae_app\" resource.label.\"module_id\"=\"default\"",
          "goodServiceFilter": "metric.type=\"appengine.googleapis.com/http/server/response_count\" resource.type=\"gae_app\" resource.label.\"module_id\"=\"default\" metric.label.\"response_code\"=\"200\"",
        }
     }
   },
   "goal": 0.98,
   "rollingPeriod": "86400s",
   "displayName": "98% Successful requests in a rolling day"
}
Finally, I submitted the request to the API using Postman - you could do the same using the API Explorer or even curl. The response was successful and returned the SLO name in the body:
{
  "name": "projects/<project number>/services/gae:<project ID>_default/serviceLevelObjectives/<SLO name>",
  "serviceLevelIndicator": {
    "requestBased": {
      "goodTotalRatio": {
        "goodServiceFilter": "metric.type=\"appengine.googleapis.com/http/server/response_count\" resource.type=\"gae_app\" resource.label.\"module_id\"=\"default\" metric.label.\"response_code\"=\"200\"",
        "totalServiceFilter": "metric.type=\"appengine.googleapis.com/http/server/response_count\" resource.type=\"gae_app\" resource.label.\"module_id\"=\"default\""
      }
    }
  },
  "goal": 0.98,
  "rollingPeriod": "86400s",
  "displayName": "98% Successful requests in a rolling day"
}
Alerting on SLO
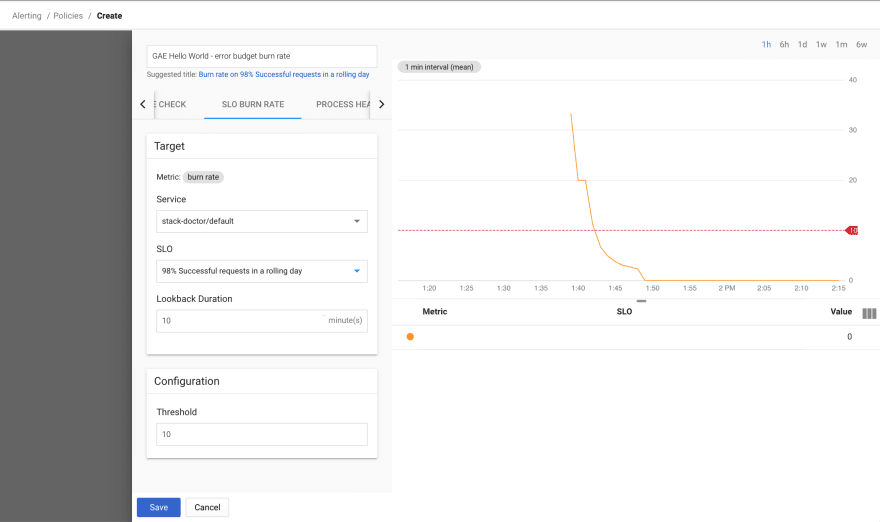
Now that my SLO was defined, I wanted to achieve two things - create an alert for SLO violation and figure out how to get a status without tripping an alert. I was able to use the UI to create an alerting policy using the "SLO BURN RATE" condition type:
When setting up the alerting policy, I ran into two fields whose meaning was not immediately clear to me. The first one is Lookback Duration. I was able to find an explanation in the documentation - because burn rate is fundamentally a rate of change condition, you have the option of specifying a custom lookback window. For other rate of change conditions, the lookback is set to 10 minutes and cannot be changed. From the doc for rate of change conditions:
The condition averages the values of the metric from the past 10 minutes, then compares the result with the 10-minute average that was measured just before the duration window. The 10-minute lookback window used by a metric rate of change condition is a fixed value; you can't change it. However, you do specify the duration window when you create a condition.
The second field that confused me was the threshold. A bit more thought led me to believe that this is the threshold for the rate of error budget burn - applied to the specified lookback duration. So, using 10 minutes for the lookback and 10 for the threshold would result in a condition that would trip if 10% of the total error budget was burned over a 10 minute period.
Triggering alert
Once my alerting policy was configured, I wanted to see what would happen if there was an availability issue. I rewrote the service to throw an error half the time:
func main() {
    r := mux.NewRouter()
    r.HandleFunc("/", func(w http.ResponseWriter, r *http.Request) {

        rand.Seed(time.Now().UnixNano())
        n := rand.Intn(10) // n will be between 0 and 10
        fmt.Printf("randon number was %d\n", n)
        if n < 6 {
            http.Error(w, "error!", 500)

        } else {
            fmt.Fprintf(w, "Hello World!")
        }

    })

    http.ListenAndServe(":8080", r)
}
and redeployed the app. Fairly quickly, I got an incident:
I was satisfied with this and redeployed the app with the original code to get it working again. In short order, the incident was resolved.
Retrieving SLO Status
Alerting on error budget burn is obviously necessary, but there will be times when we'll need to know the status of our SLO long before an issue. As such, I needed a way to query the SLO data. I followed the documentation and used the timeSeries.list method of the monitoring API.
I thought of two primary questions I would want to be able to answer - what is the availability of my service over a given time period and what is the status of my error budget at a given point in time?
SLO Status
The first is answered using the "select_slo_health" time series. I sent a request to https://monitoring.googleapis.com/v3/projects/stack-doctor/timeSeries with the following parameters:
name:projects/<project ID>
filter:select_slo_health("projects/<project number>/services/gae:<project ID>_default/serviceLevelObjectives/<SLO name>")
interval.endTime:2020-01-06T17:17:00.0Z
interval.startTime:2020-01-05T17:17:00.0Z
aggregation.alignmentPeriod:3600s
aggregation.perSeriesAligner:ALIGN_MEAN
I used the SLO name that was returned when I created the SLO in the previous steps. I could have also used a call to https://monitoring.googleapis.com/v3/projects//services/gae:_default/serviceLevelObjectives to retrieve the SLOs I have configured against my default App Engine service.
I specified a 24hr interval to retrieve the data with an alignment of 1 hour using the mean aligner. If I was going to chart the data, I could have used a shorter alignment period and a more precise aligner, but this sufficed for my purposes. The results looked like this:
{
  "timeSeries": [
    {
      "metric": {
        "type": "select_slo_health(\"projects/860128900282/services/gae:stack-doctor_default/serviceLevelObjectives/2IooYmjTSROak0g9f-DmpA\")"
      },
      "resource": {
        "type": "gae_app",
        "labels": {
          "project_id": "stack-doctor"
        }
      },
      "metricKind": "GAUGE",
      "valueType": "DOUBLE",
      "points": [
        {
          "interval": {
            "startTime": "2020-01-06T17:17:00Z",
            "endTime": "2020-01-06T17:17:00Z"
          },
          "value": {
            "doubleValue": 1
    …
As expected, the output shows me the fractional ratio of good requests to total requests for each interval (that matches my alignmentPeriod) within the total interval (as specified by interval.startTime and endTime). For my service, each value was 1, meaning that 100% of the requests were good for each hourly interval.
Error Budget Status
The second question I wanted to answer is "how much error budget do I have left?" The operator for that is the select_slo_budget_fraction. The only change in the request is to change the filter:
filter:select_slo_budget_fraction("projects/860128900282/services/gae:stack-doctor_default/serviceLevelObjectives/2IooYmjTSROak0g9f-DmpA")
interval.endTime:2020-01-06T17:17:00.0Z
interval.startTime:2020-01-05T17:17:00.0Z
aggregation.alignmentPeriod:3600s
aggregation.perSeriesAligner:ALIGN_MEAN
After making a request to the timeSeries.list method, I got the following return:
{
  "timeSeries": [
    {
      "metric": {
        "type": "select_slo_budget_fraction(\"projects/860128900282/services/gae:stack-doctor_default/serviceLevelObjectives/2IooYmjTSROak0g9f-DmpA\")"
      },
      "resource": {
        "type": "gae_app",
        "labels": {
          "project_id": "stack-doctor"
        }
      },
      "metricKind": "GAUGE",
      "valueType": "DOUBLE",
      "points": [
        {
          "interval": {
            "startTime": "2020-01-06T17:17:00Z",
            "endTime": "2020-01-06T17:17:00Z"
          },
          "value": {
            "doubleValue": 1
          }
        },
    ….
As before, each "value" represents the fraction of the error budget remaining at that point. As my service is not burning error budget, the numbers stay at 1. I could have also used the select_slo_budget operator to get the actual remaining budget - the count of errors remaining.
In conclusion...
I hope you found this introduction to the Service Monitoring API useful. Thank you for reading, and let me know if you have any feedback. Until next time!

Posted on January 7, 2020
Join Our Newsletter. No Spam, Only the good stuff.
Sign up to receive the latest update from our blog.


