Uptrace v1.6 is available

Vladimir Mihailenco
Posted on March 25, 2024

The Uptrace team is pleased to present the latest v1.6 release, which adds support for service graphs, Prometheus remote write, Grafana data source for Prometheus, annotations, and much more.
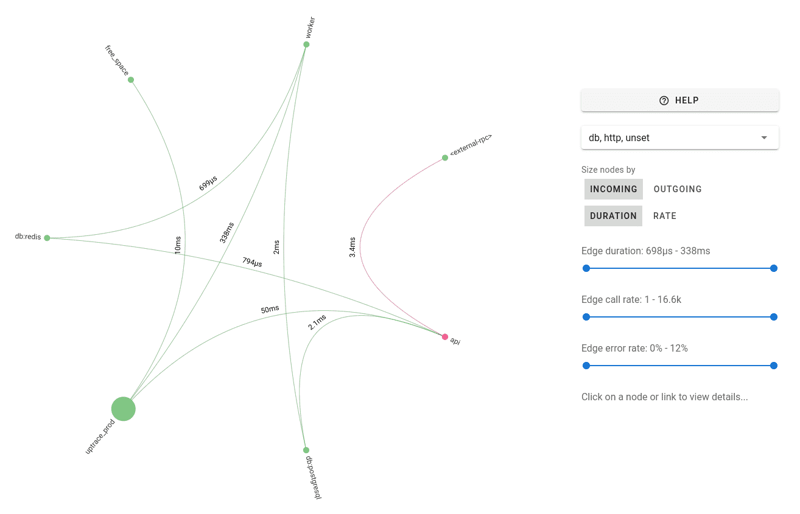
Service Graphs
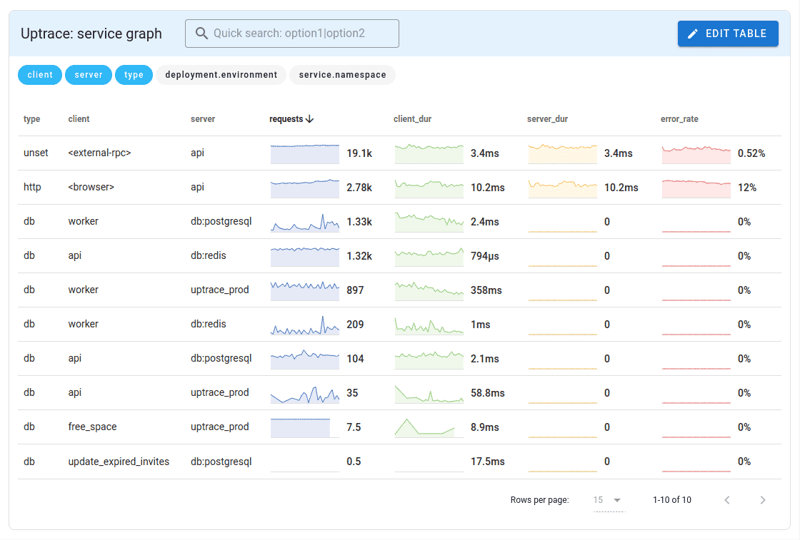
Service Graphs provide a visual representation of service interactions, dependencies, and performance metrics. They are built by analyzing span relationships and require certain span attributes.
The same data is also available as a metrics dashboard which comes by default with Uptrace:
Prometheus remote write
Starting with the v1.6 release, Uptrace natively supports Prometheus Remote Write protocol, which allows Prometheus to send its collected metrics data to a long-term storage solution such as Uptrace.
You can configure Prometheus Remote Write using the following endpoint:
remote_write:
  - url: 'http://localhost:14318/api/v1/prometheus/write'
    headers: { 'uptrace-dsn': 'http://project2_secret_token@localhost:14318?grpc=14317' }
The configuration above allows to send Prometheus data directly to Uptrace without using OpenTelemetry Collector.
Grafana Prometheus data source
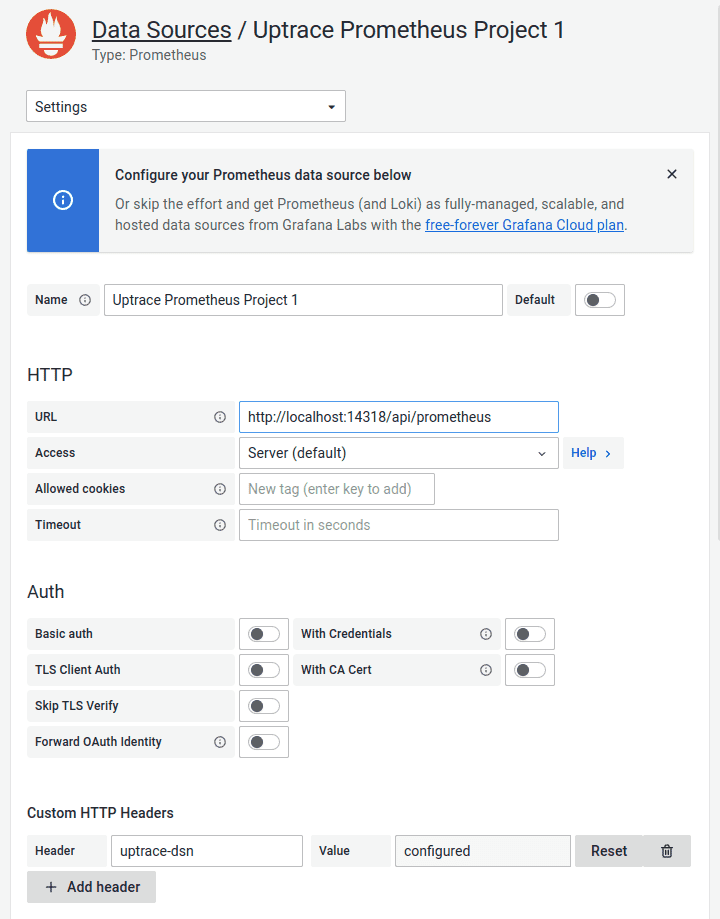
You can also use Uptrace as a Prometheus data source in Grafana. Uptrace uses the original Prometheus engine so all Prometheus queries should be supported and you should be able to use existing Grafana dashboards with the Uptrace data source.
- In Grafana, go to "Configururation" -> "Data source".
- Click on "Add data source" and then select "Prometheus".
- As an URL, use the Uptrace HTTP address, for example,
http://localhost:14318/api/prometheusorhttps://api.uptrace.dev/api/prometheus. - In "Custom HTTP Headers" section, click "Add header" to specify Uptrace DSN.
- Header:
uptrace-dsn - Value:
http://project2_secret_token@localhost:14318?grpc=14317
Chart annotations
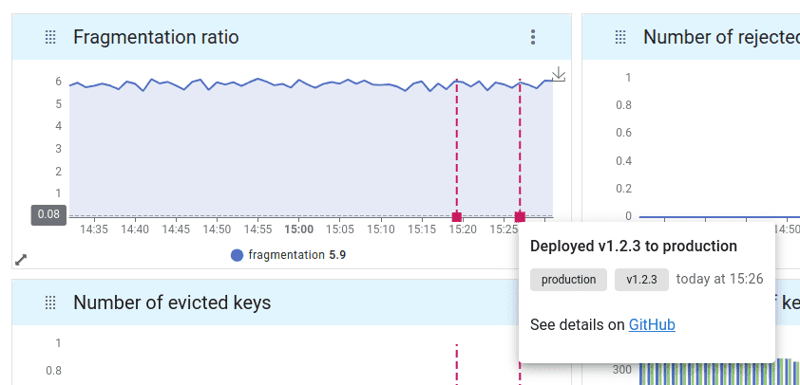
Chart annotations are labels or notes added to a chart to provide additional information or context. Annotations help clarify the data presented in the chart and help the viewer understand key points or trends.
Uptrace displays annotations as square dots on the x-axis. Clicking on an annotation displays the annotation description and tags. The description field can contain markdown links to other systems with more details.
You can create annotations by sending an HTTP POST request to the Uptrace API, for example, when deploying a new version of your application:
curl -X POST http://localhost:14318/api/v1/annotations \
   -H 'uptrace-dsn: https://<token>@api.uptrace.dev/<project_id>' \
   -d '{"name":"Deployed to production", "attrs": {"service.version": "540d2ee"}}'
See documentation for more details.
HTTPcheck Receiver
HTTP Check Receiver is a component of the OpenTelemetry Collector that can be used to perform synthetic checks against HTTP endpoints, for example:
receivers:
  httpcheck:
    targets:
      - endpoint: 'https://api.uptrace.dev/health/status'
        method: GET
    collection_interval: 15s
Starting with the v1.6 release, Uptrace comes with a pre-built dashboard to visualize the collected data:
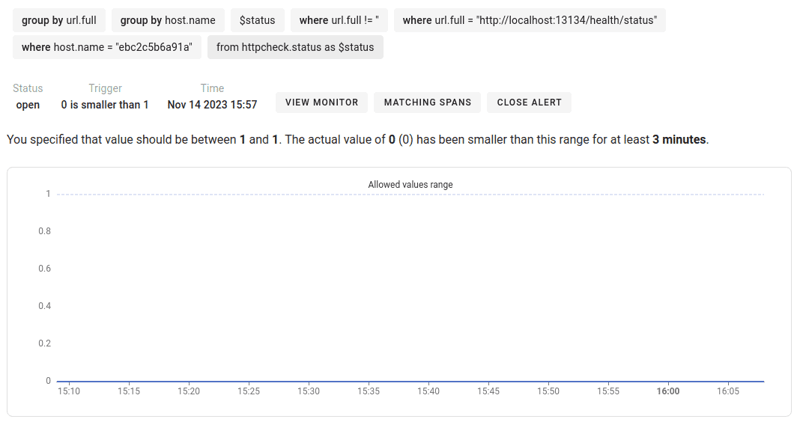
Just like with other metrics, you can create monitors to receive notifications when certain conditions are met:
See OpenTelemetry HTTP check for details.
Uptrace DSN
Uptrace DSN (Data Source Name) is a connection string that is used to connect and send data to an Uptrace backend. It contains a backend address (host:port) and a secret token that grants access to a project.
If the recent version Uptrace DSN was extended to also contain the gRPC port in case you're using the OTLP/gRPC exporter:
# before
UPTRACE_DSN="http://project1_secret_token@localhost:14318/1"

# after
UPTRACE_DSN="http://project1_secret_token@localhost:14318?grpc=14317"
Previously issued DSNs are still fully supported.
Conclusion
The full list of changes is available on GitHub, where you can also download the latest version or run Uptrace locally using Docker.
You can also sign up for a free Cloud account and get 1TB of storage and 50,000 timeseries. No credit card required.

Posted on March 25, 2024
Join Our Newsletter. No Spam, Only the good stuff.
Sign up to receive the latest update from our blog.
