Quick API Debugging Tip

Sam Ringleman
Posted on June 14, 2019
I learned this trick a couple years ago and it has saved me so much time that it's only prudent to share.
Say you built an API, and you are working on the front end to consume the awesomeness that is your API. You get your form set up to log your user in. Hit the send button and you get a 400 response. Wait, what the what? I have a very simple starting point that you can use with tools you are probably already using.
This tip involves either Google Chrome, or Mozilla Firefox. There might be more, but these are the two browsers that I use. As well as the Postman app. These are all free to use, so use them. They are awesome!
- Open your dev tools.
- Chrome (cmd + alt + i)
- Firefox (cmd + alt + i)
- Go to the network tab.
- Find the failing request.
- Right click and copy as cURL.
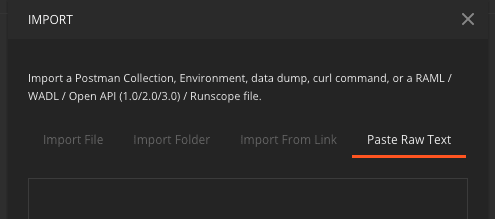
- Open Postman and select import.
- Select the "Paste Raw Text" tab.
- Paste your cURL request you copied from your browser and hit Import.
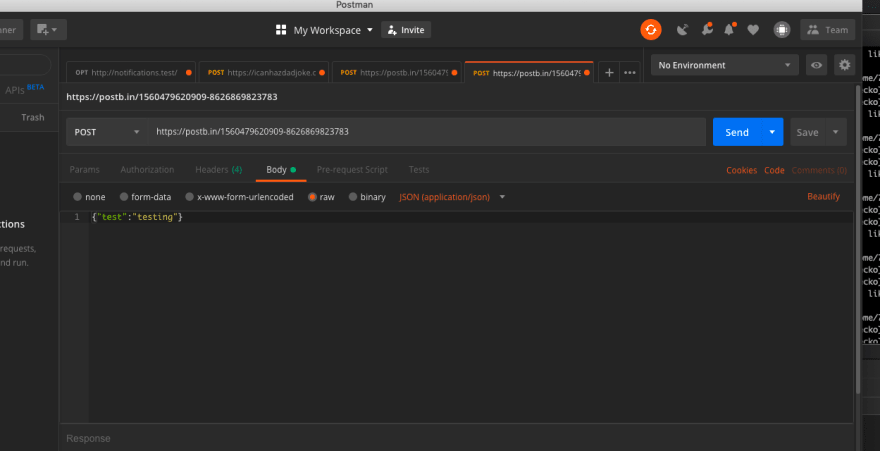
- Send your request for much easier debugging.
One thing to take note of, your request is completely imported into Postman. This makes it very simple to debug your request. You can see your data easier and any headers sent in their nice UI.
As a backend dev, I find it handy for the front end dev to send that request to me in chat. This way I can recreate what is breaking in my API with the exact data that they are sending.
I use this trick on a daily basis. I hope that you will too!

Posted on June 14, 2019
Join Our Newsletter. No Spam, Only the good stuff.
Sign up to receive the latest update from our blog.


