JavaScript Unit Test Debugging with VSCode

Scofield Idehen
Posted on June 11, 2023

Debugging JavaScript unit tests is an essential skill for developers, as it helps uncover issues and gain insights into the code's behaviour.
While console.log statements are commonly used for debugging, VSCode's built-in debugger offers a more powerful and efficient way to debug unit tests.
This article will explore how to set up and utilize the debugger in VSCode to effectively debug JavaScript unit tests, using popular frameworks like Mocha and Jest as examples.
Enabling the Debugger
The first step is to enable the debugger in VSCode. This process has become remarkably simple.
By opening the command palette and searching for "JavaScript Debug Terminal", developers can quickly access the terminal that automatically connects to the debugging process.
Setting Breakpoints
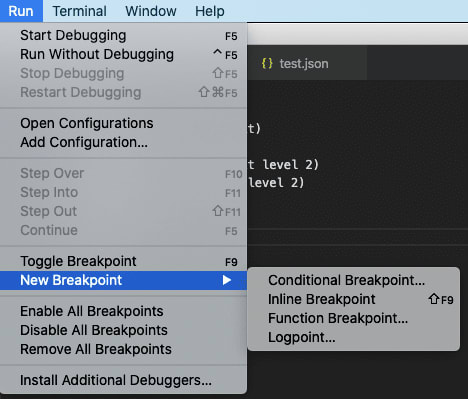
Breakpoints are fundamental in the debugging process, allowing developers to pause the execution of their code and examine its state.
To set a breakpoint in VSCode, click on the desired line number in the editor, and a red dot will indicate the breakpoint's placement.
Running the Code
With breakpoints set, the next step is to run the code containing the unit tests. Whether using the npm start or npm run test commands, the code will execute as usual, but with the added benefit of being connected to the debugger.
Navigating through Code Execution
When the execution reaches a breakpoint, the debugger will pause the code, giving developers an opportunity to explore its current state and step through it.
VSCode offers several controls for this purpose.
- "Step over" allows developers to move to the next line of code and pause the execution.
- "Step in" executes the current line of code and, if it calls a function, pauses at the beginning of that function.
- "Step out" executes the current line and the rest of the current function, pausing at the next line in the calling context.
- Additionally, explicitly set breakpoints will always stop the execution at their designated locations.
Watching Expressions
To gain further insights into variable values during debugging, VSCode provides a "watch" feature. Developers can add expressions to the debug "watch" pane, displaying their current values when the execution is paused. This feature proves invaluable for tracking the changes and behaviour of specific variables.
Additional Tips
To enhance the debugging experience, consider the following tips:
- Configuring Debugging for Node Modules: By default, the debugger may step into third-party node modules or Node.js internals, which might not be relevant for debugging purposes. Add the provided configuration to your project's .vscode/settings.json file to skip these files.
- Mocha and Jest Unit Testing: Mocha and Jest are widely used testing frameworks for Node.js. While similar in many aspects, they differ in terms of included features. Mocha requires separate libraries for mocking, assertions, and code coverage, whereas Jest provides built-in mocking, assertions through the global expect function, and built-in code coverage with the collectCoverage option.
Conclusion
Leveraging VSCode's debugger for JavaScript unit test debugging can significantly enhance a developer's ability to identify and resolve issues efficiently.
By setting breakpoints, running the code, and utilizing controls like "Step over," "Step in," and "Step out," developers can navigate through their code and gain a deep understanding of its execution.
Furthermore, the "watch" feature allows for real-time monitoring of expressions and variables.
With these techniques, developers can master JavaScript unit test debugging and streamline their development process.
If you find this post exciting, find more exciting posts like this on Learnhub Blog; we write everything tech from Cloud computing to Frontend Dev, Cybersecurity, AI and Blockchain.
Resource

Posted on June 11, 2023
Join Our Newsletter. No Spam, Only the good stuff.
Sign up to receive the latest update from our blog.
Related
December 31, 2022


