Studio 3T Performance Suite: How to Identify and Resolve Performance Bottlenecks in MongoDB

Roman Right
Posted on February 1, 2024

Introduction
In today's data-driven landscape, the performance of databases is not just a technical concern but a pivotal factor in the success of any application. MongoDB, renowned for its scalability and flexibility, is no exception. However, as systems grow in complexity and data volume, performance bottlenecks can emerge, significantly impacting user experience and system reliability. This article delves into harnessing the power of Studio 3T, a comprehensive tool suite for MongoDB, to optimize database performance. We will explore how Studio 3T's features, like the Query Profiler, Index Manager and Visual Explain, can be used to identify and resolve common performance issues, ensuring that your MongoDB database runs efficiently and effectively.
Understanding the Query Profiler
The Heart of Performance Analysis
The Query Profiler in Studio 3T stands as a vital instrument for enhancing MongoDB's performance. Integrating the capabilities of MongoDB's Database Profiler, it offers an in-depth examination of your database operations. This tool is essential in illuminating both the execution time and patterns of your queries, providing a surprising degree of useful insight.
Spotting Slow Queries: A Practical Scenario
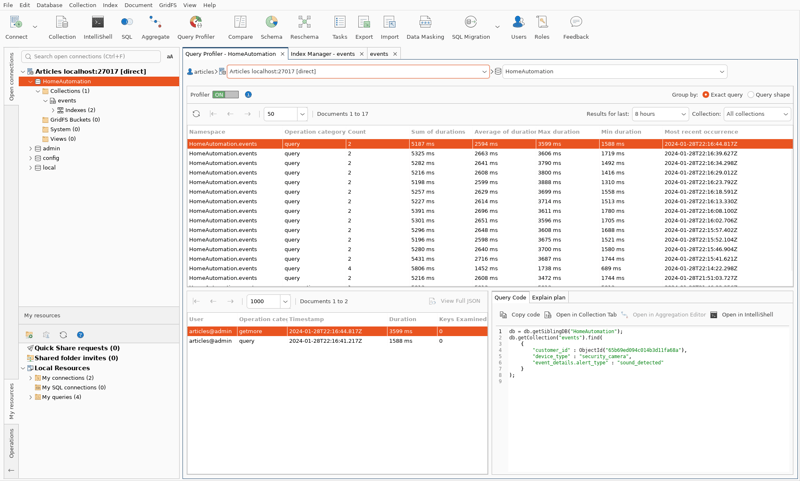
Consider a smart home system that processes a myriad of device events for a wide customer base. Each event, whether from a security camera or a smart thermostat, results in a data entry. Envision this system bogged down by a particular query:
{
  "customer_id": ObjectId('65b69ed094c014b3d11fa889'),
  "device_type": "security_camera",
  "event_details.alert_type": "sound_detected"
}
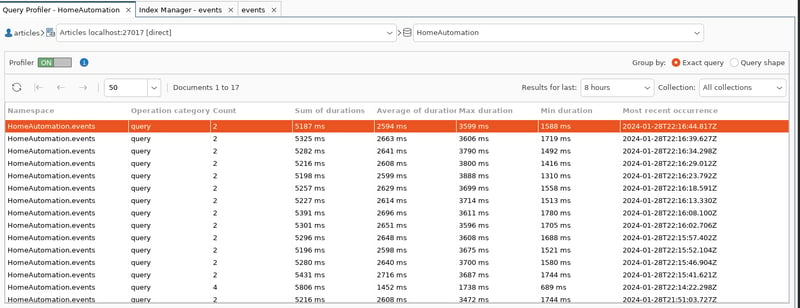
In the absence of efficient indexing, the execution time of this query stretches to an excruciating 2.5 seconds, an unacceptable delay in a real-time monitoring scenario.
In this instance, the Query Profiler adeptly identifies the tardy query. Its graphical display reveals vital statistics, such as execution time and frequency, which are instrumental in understanding the query's impact on the system's overall performance. This leads us to two crucial components of the Query Profiler:
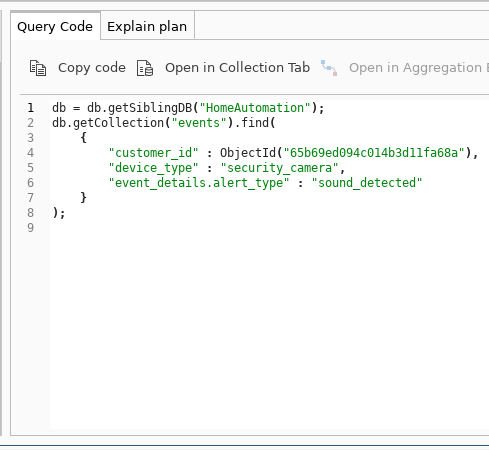
Query Code Window: This section displays the query in question, aiding developers in pinpointing the problematic segment in the code base. It serves as a direct link between the observed performance issue and the specific part of the code that may require optimization.
Validating Improvements using Visual Explain
Demystifying Query Execution with Visual Insights
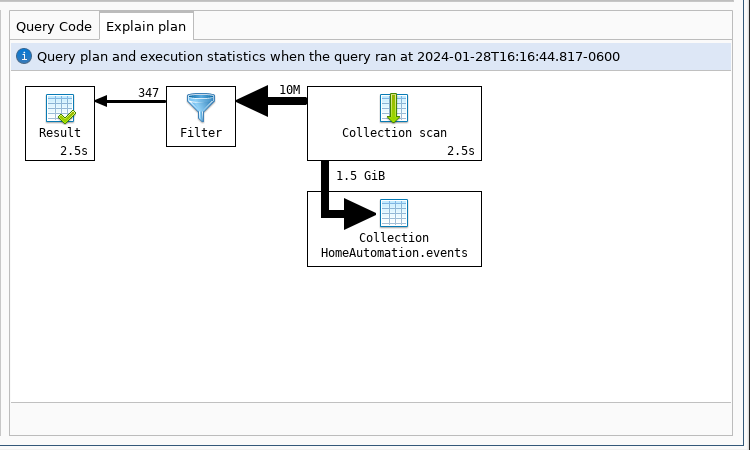
Visual Explain in Studio 3T is an invaluable tool for comprehensively understanding the execution process of MongoDB queries. It provides a detailed graphical representation of how queries are executed and the impact of different indexes on these processes. In addition to the visualisation, Visual Explain provides runtime stats for each step, showing how much data is being transferred and how long it has taken. It is available in the main query tools in Studio 3T and now also in its own window in the Query Profiler.
Explain Plan Window: Here, the profiler presents a graphical explanation of the query execution process. This visual breakdown includes various stages of the query execution, notably highlighting steps like 'collection scan.' A 'collection scan' indicates the absence of an index at a critical point, signaling a potential area for performance enhancement through indexing strategies.
Equipped with this comprehensive analysis, developers gain the necessary insights to make informed decisions, such as refining the query or implementing the required indexes, to optimize performance.
Optimizing with the Index Manager
Streamlining Performance through Strategic Indexing
The Index Manager in Studio 3T is a pivotal tool for optimizing query performance in MongoDB. It plays a critical role in identifying and creating indexes that can significantly reduce query execution times. By efficiently managing indexes, the Index Manager ensures that your database operations are streamlined and performant.
Case Study: Enhancing Query Speed with a Custom Index
To illustrate, let's revisit the slow query from our smart home system scenario:
{
  "customer_id": ObjectId('65b69ed094c014b3d11fa889'),
  "device_type": "security_camera",
  "event_details.alert_type": "sound_detected"
}
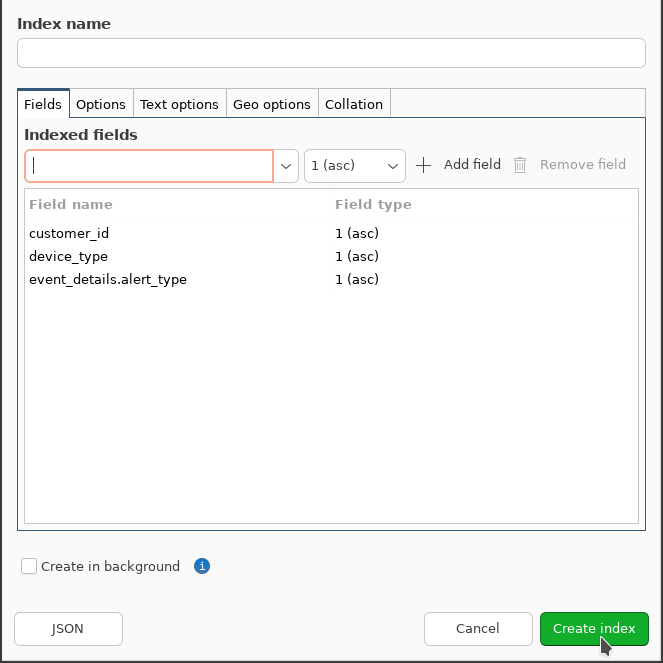
To address the 2.5-second delay in query execution, we can use the Index Manager to create a compound index. This index would be on the fields customer_id, device_type, and event_details.alert_type. By doing so, we are aligning the index directly with the query's structure, allowing MongoDB to retrieve the necessary data more efficiently.
In this screenshot, we see the Index Manager showcasing the creation of the new compound index. The fields customer_id, device_type, and event_details.alert_type are highlighted, demonstrating how the index aligns with the query structure.
Observing the Impact of the New Index on Execution Time
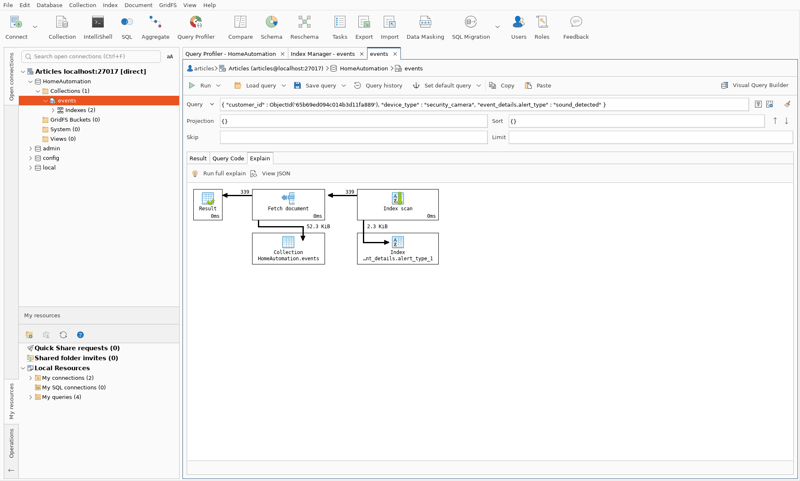
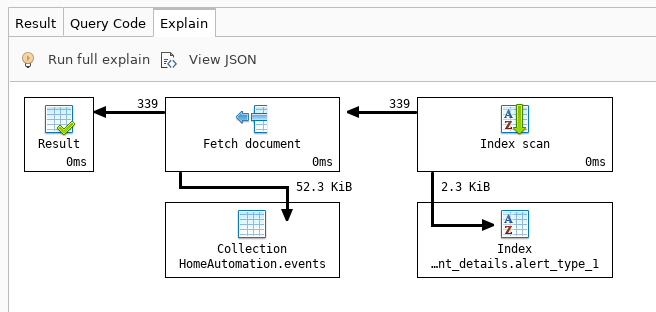
With the new index created via the Index Manager, we used Visual Explain to evaluate its effect on our query. This tool graphically displays the modified execution plan. The key alteration is the switch from a collection scan to an index scan, reflecting a more efficient data retrieval method.
The Visual Explain interface highlights this change, emphasizing the faster index scan. Remarkably, the total execution time of the query is now shown as 0ms, a significant decrease from the original 2.5 seconds, demonstrating the substantial impact of the optimization.
Checking Results in the Query Profiler
Confirming Optimization Success
The final step in our optimization journey involves revisiting the Query Profiler in Studio 3T. This tool, which initially helped us identify the slow query, now serves to confirm the effectiveness of our optimization strategies.
In the Query Profiler display, we observe a significant change. The previously sluggish query, after optimization, is conspicuously absent from recent query executions. We only see historical instances from before the optimization. This indicates that the query, now executing in under a millisecond, is no longer a bottleneck in performance. This marked improvement is a strong endorsement of our indexing strategy and the comprehensive optimization process.
Conclusion
Harnessing Studio 3T for Peak MongoDB Performance
In conclusion, this guide has demonstrated the power and utility of Studio 3T's tools in identifying and resolving performance issues within MongoDB databases. Starting with the Query Profiler, we identified a performance bottleneck. We then utilized the Index Manager to strategically create an index, drastically improving query execution times. The Visual Explain feature provided us with a clear, graphical representation of this improvement, showing a reduction in execution time to under a millisecond. Finally, our return to the Query Profiler confirmed the elimination of the slow query from recent executions, validating the effectiveness of our optimization efforts.
This journey underscores the importance of a systematic approach to database performance tuning. By leveraging Studio 3T’s comprehensive suite of tools, developers and database administrators can ensure their MongoDB databases are running efficiently and effectively. I encourage readers to apply these methodologies to their own databases, ensuring they remain high-performing and robust in handling data-intensive operations.

Posted on February 1, 2024
Join Our Newsletter. No Spam, Only the good stuff.
Sign up to receive the latest update from our blog.
Related

February 1, 2024

