Chartjs with Gradient Background

Ricardo Nishimura
Posted on February 7, 2021
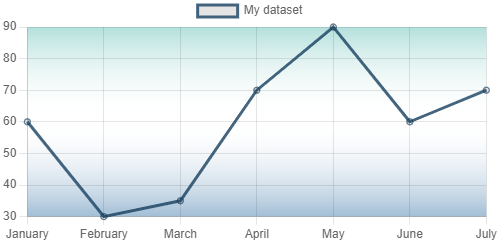
How to add a gradient background for the entire Chart.js and not just for the dataset, that was my first question when I started to play with it, so here I am...
Chart Plugins
The Chartjs Plugins are the most efficient way to customize or change the default behavior of a chart. They have been introduced at version 2.1.0 (global plugins only) and extended at version 2.5.0 (per chart plugins and options).
With a custom plugin we can draw a custom background implementing the function "beforeDraw".
There were some changes to the plugin interface in the ChartJs version 3, this code example was updated to reflect it, thanks to Hung Tran for pointing me out.
The following plugin draws a custom gradient in the chart background:
var GradientBgPlugin = {
  beforeDraw: function(chart, args, options) {
    const ctx = chart.ctx;
    const canvas = chart.canvas;
    const chartArea = chart.chartArea;

    // Chart background
    var gradientBack = canvas.getContext("2d").createLinearGradient(0, 0, 0, 250);
    gradientBack.addColorStop(0, "rgba(60, 174, 163, 0.7)");
    gradientBack.addColorStop(0.5, "rgba(255, 255, 255, 0)");
    gradientBack.addColorStop(1, "rgba(32, 99, 155, 0.7)");

    ctx.fillStyle = gradientBack;
    ctx.fillRect(chartArea.left, chartArea.bottom,
      chartArea.right - chartArea.left, chartArea.top - chartArea.bottom);
  }
};
Then insert the custom plugin in the Chart configuration and voilà:

Posted on February 7, 2021
Join Our Newsletter. No Spam, Only the good stuff.
Sign up to receive the latest update from our blog.


