Debugging TypeScript using Replay

Cecelia Martinez
Posted on March 18, 2022
Recently, I sat down with Mateusz Burzyński, aka AndaristRake, to talk about how he debugged an issue in TypeScript using Replay for Node. With the replay-node-cli, you can record a Node runtime for debugging after the fact — no browser required.
The bug
The bug, described in the GitHub issue here, happens when using a newer feature in TypeScript that supports control flow analysis on dependent parameters contextually typed from a discriminated union type. 😅 There’s a lot to unpack there!
Take a look at the example below, and we’ll break it down.
interface Foo {
  method(...args: ['a', number] | ['b', string]): void
};

const methodSyntax: Foo = {
  method(kind, payload) {
    if (kind === 'a') {
      payload.toFixed(); // error, Property 'toFixed' does not exist on type 'string | number'
    }
    if (kind === 'b') {
      payload.toUpperCase(); // error, Property 'toUpperCase' does not exist on type 'string | number'
    }
  }
}
Here we have a union type, which just means a combination of multiple types. The argument for our function can be number | string. A discriminated union means that there is a parameter that helps you distinguish (or discriminate) which type in the union applies (There’s a great blog post here on discriminated unions from CSS-Tricks).
In this case, we should be able to check kind and if it’s a, the type should be narrowed to number. Same goes for b, it should be narrowed to string. This is what is meant by “control flow analysis” — we can use an if statement or other logical check to narrow the type.
However, that’s not working in our example. Instead, the type is still number | string for each parameter.
The debugging process
Mateusz walked us through how he investigated and ultimately identified the root cause of the bug using Replay. These steps can be used for any issue, and are a great example of how a developer debugs in the real world.
Generate a reproducible example
This step was easy thanks to Replay. To get started debugging this issue, Mateusz recorded a small test of the following code. Using replay-node-cli he recorded the run to create a debuggable replay of the bug.
 type Foo = {
  method(...args:
    [type: "str", cb: (e: string) => void] |
    [type: "num", cb: (e: number) => void]
  ): void;
}

// this fails for some reason, as a method
let fooBad: Foo = {
  method(type, cb) {
    if (type == 'num') {
      cb(123) // error!
    } else {
      cb("abc") // error!
    }
  }
};
Identify expected behavior
The next step in debugging is understanding what is supposed to happen when the application works as expected.
The original GitHub issue has a playground reproduction that shows this feature works when using function declaration syntax and manual destructuring, but fails when using the method syntax.
Because the bug only occurs when using the method syntax, we can make an example of what should happen when this works properly. Mateusz also recorded a replay here of the working behavior when using an arrow function syntax.
type Foo = {
  method(...args:
    [type: "str", cb: (e: string) => void] |
    [type: "num", cb: (e: number) => void]
  ): void;
}
// suddenly works for arrow function
let fooOkay1: Foo = {
  method: (type, cb) => {
    if (type == 'num') {
      cb(123)
    } else {
      cb("abc")
    }
  }
};
Understanding what working code looks like is critical to debugging, because it allows you to identify what is different between the working and non-working code.
It also gives you a goalpost for debugging. Before you define your problem, you need to know what the application is expected to do in a given situation.
Define the problem
We are now able to define the problem very specifically. Using a framework of “expected behavior” and “actual behavior” is a clear way to define the bug.
✅ Expected behavior: TypeScript should narrow the type of a discriminated union when using control flow analysis in a declared method.
🚫 Actual behavior: TypeScript does not narrow the type in declared method only.
Now that we know the problem, we can start investigating why it occurs.
Isolate the issue
Next was understanding where in the code the error was actually happening. To do this, it’s important to understand what code executed at the time the error occurred.
Replay helps with this by showing how many times a given line of code was hit during the recording. You can also lock in to a specific instance of that code’s execution to inspect your application values at that time.
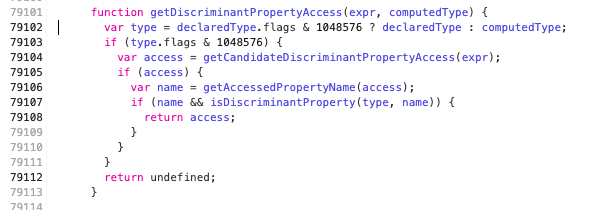
Mateusz started with the getDiscriminantPropertyAccess function, which takes in computedType and expr parameters. From reviewing the code when this feature was added to TypeScript, he identified this function as related to the narrowing process.
With the Replay console, you can view the value of properties at a given time during the code execution. Once the functions related to the bug have been isolated, the values of these parameters can be evaluated. This can be done with print statements or using the console.
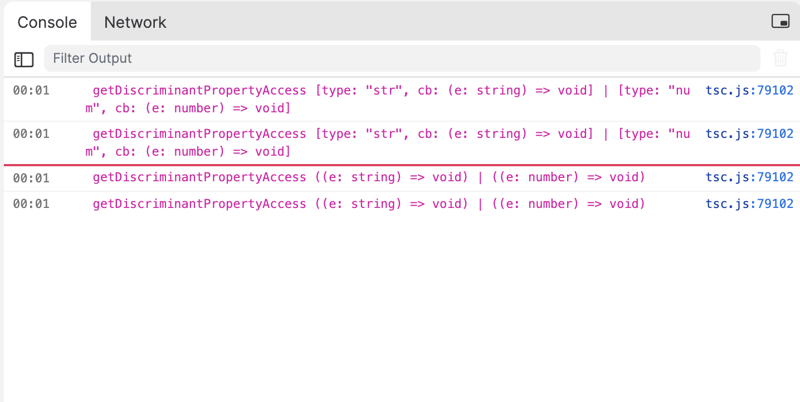
Mateusz output computedType with the helper function .__debugTypeToString() to further evaluate.
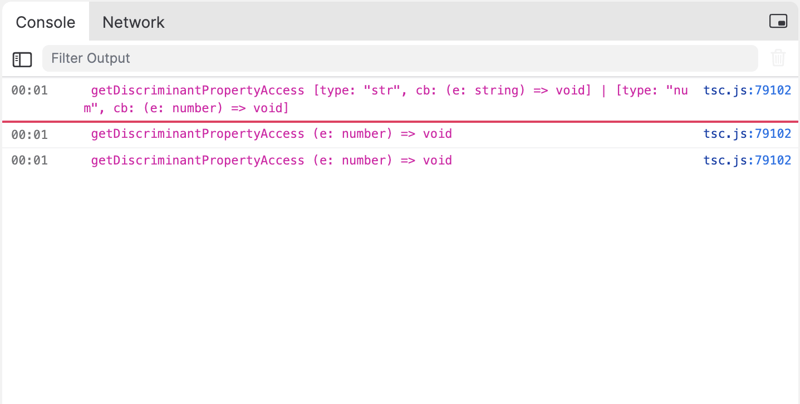
The issue here is that the type should come back as either string or number depending on the variable, but instead both are showing a type of string | number which is causing the failure because of a type mismatch.
In the working example, however, the type evaluated correctly as number.
Tracing the root cause
Mateusz then used Replay’s stepping functionality to trace the execution of the code. By comparing the working example with the non-working example, he was able to identify lines that only executed in the working example. The lines after the declaration of access aren’t executed when the bug occurs. We can see in the replay that these lines show 0 hits on hover.
Because access is being evaluated on line 79105 and failing the check, the next step is looking at getCandidateDiscriminantPropertyAccess() to see the return value.
We can see on line 79060 inside this function that reference is being evaluated to see if ts.isBindingPattern() or ts.isFunctionExpressionOrArrowFunction() is true. Because our syntax is method syntax and not a function expression or arrow function, the reference fails the check and the function does not continue.
We can see this by printing the function to the console to see the return value.
Broken version returns false, type is not narrowed
Working version returns true, type is narrowed
The fix
We need to ensure that a function declared with the method syntax also evaluates true within the getCandidateDiscriminantPropertyAccess() function so it is narrowed appropriately.
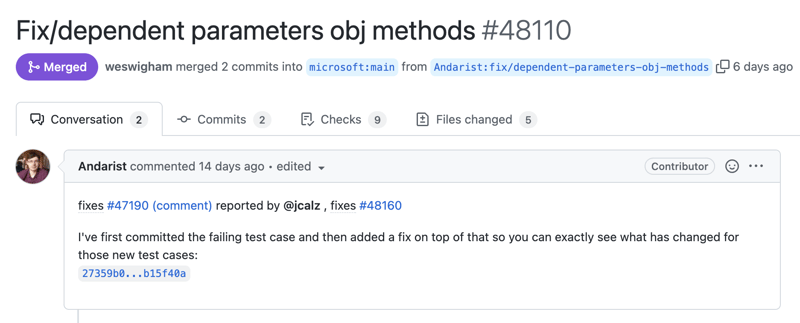
Here is the pull request with the suggested resolution by Mateusz, which adds an option for isObjectLiteralMethod() to the check to ensure that method syntax will also trigger the destructuring of the discriminant union. The fix was merged and this bug has officially been resolved! 🥳
👉 Want to record your own Node applications? Check out the Replay Node guide here and let us know at replay.io/discord if you have any questions!

Posted on March 18, 2022
Join Our Newsletter. No Spam, Only the good stuff.
Sign up to receive the latest update from our blog.


