The bpmn-visualization project celebrates its 1st anniversary

Thomas Bouffard
Posted on May 25, 2021

To celebrate the first year of our work on the bpmn-visualization library, here's a look back about what has been achieved.
bpmn-visualization is an open source TypeScript library for visualizing process execution data on BPMN diagrams.
From its first public release in March 2020 to the introduction of diagram interactions in January 2021, here it is: an overview of the first year achievements.
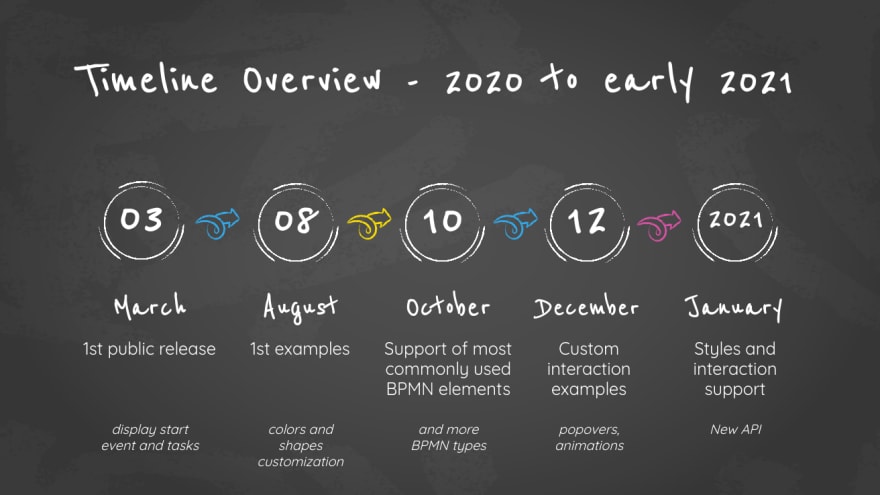
Template from Simple Blackboard Background
What can you already do today with bpmn-visualization?
Below are some examples of what can be done with bpmn-visualization.
Visit the dedicated GitHub repository if you want a more complete overview of the available capabilities.
BPMN Support
BPMN diagrams are at the foundation of the bpmn-visualization capabilities.
This animation shows the evolution of BPMN support over time. It uses the B.2.0 diagram of the BPMN Model Interchange Working Group which promotes interoperability across BPMN vendors. The fully supported diagram would look like the B.2.0 image reference
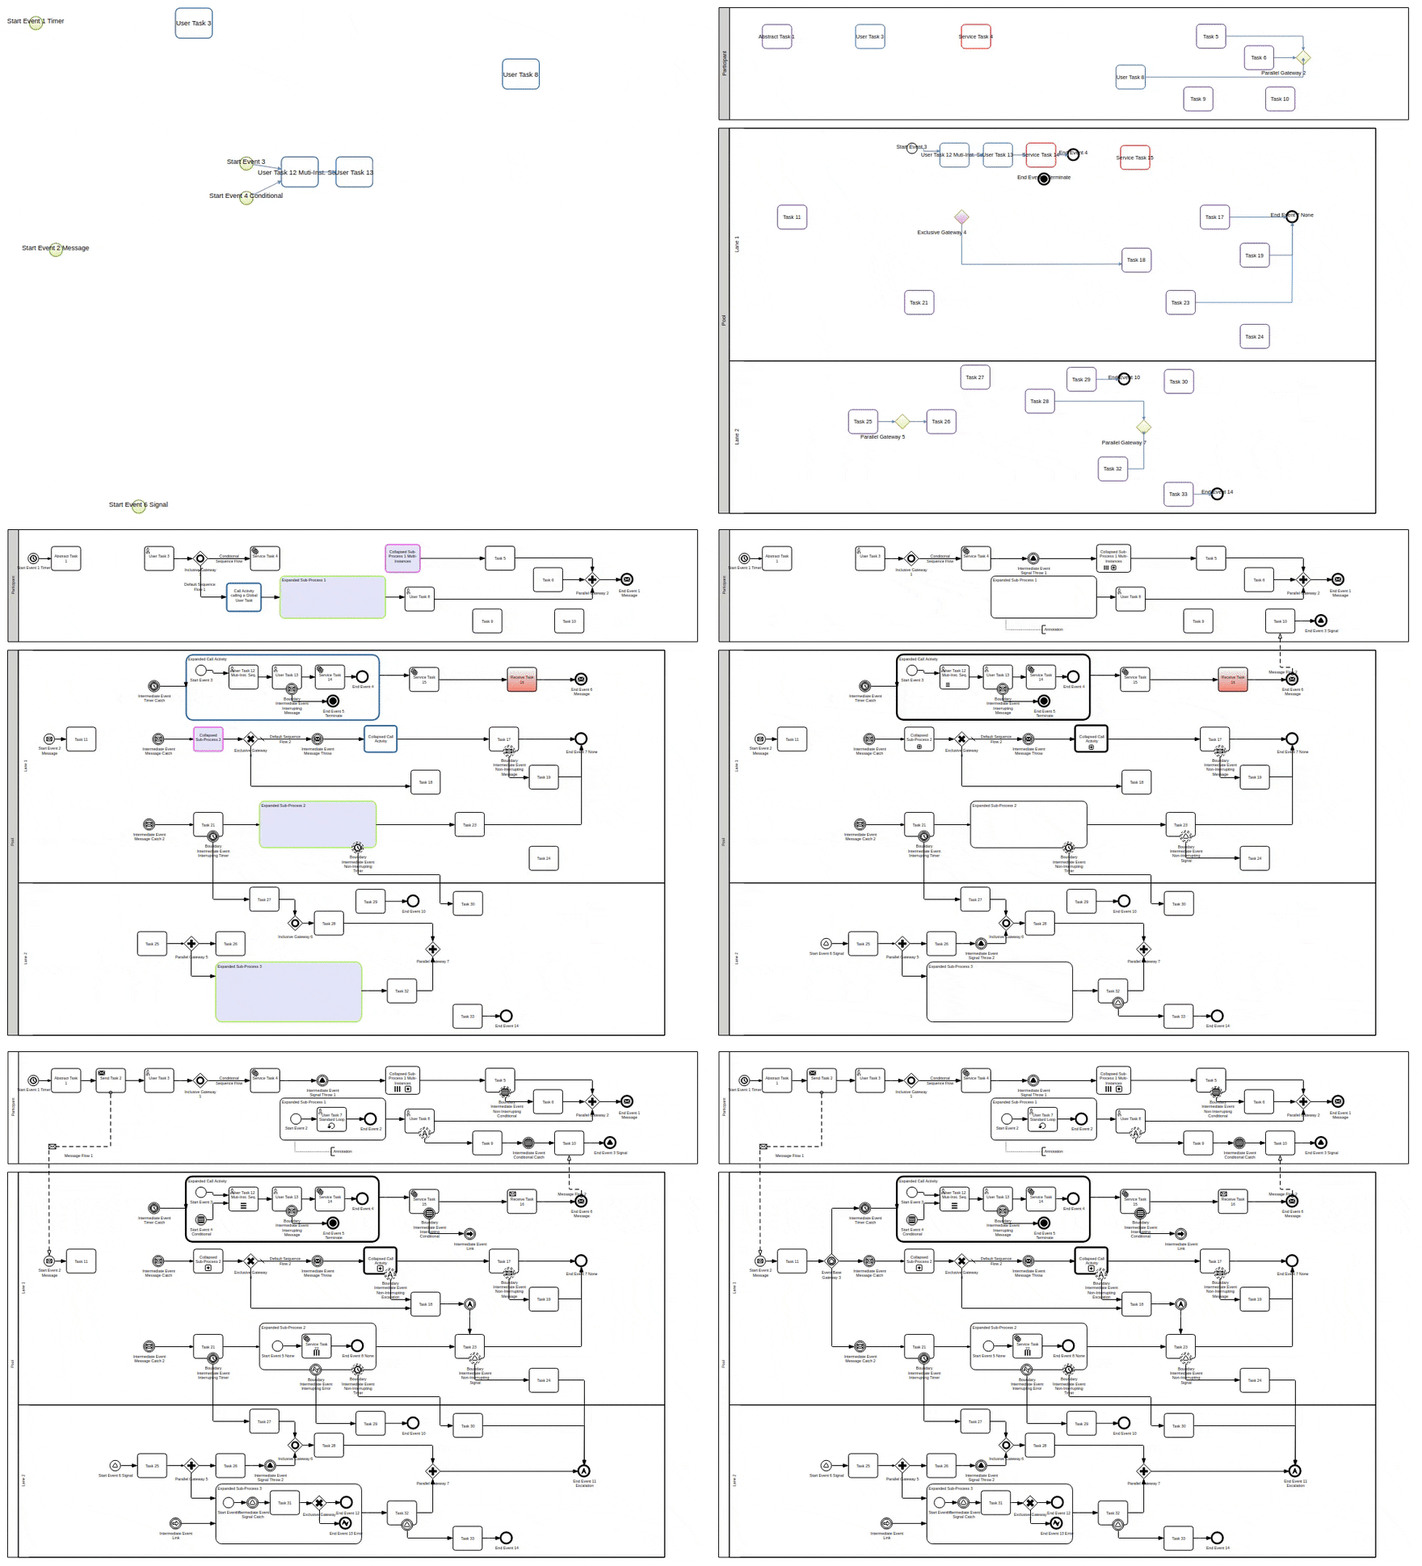
Rendering evolution of the B.2.0 BPMN Diagram
BPMN diagram navigation
In addition to BPMN model diagram rendering, bpmn-visualization provides several ways to explore and navigate through the BPMN diagrams. This is made available at load time or at runtime, through user interactions or API calls.
The navigation features are:
zoom: change the diagram scale to show details or have an overview of the diagram
fit: reset/set the zoom level and eventually translate the diagram (for instance, center the diagram)
pan: drag the diagram and move/translate it, to see hidden parts or change the position in the view
Navigation is particularly useful for large diagrams. Fitting the view to the screen provides a good overview of a large diagram, but it can be hard to see details.
You can zoom to highlight specific parts, then pan to view different diagram portions.
After navigating around, you may want to reset the zoom level and go back to a full diagram overview.
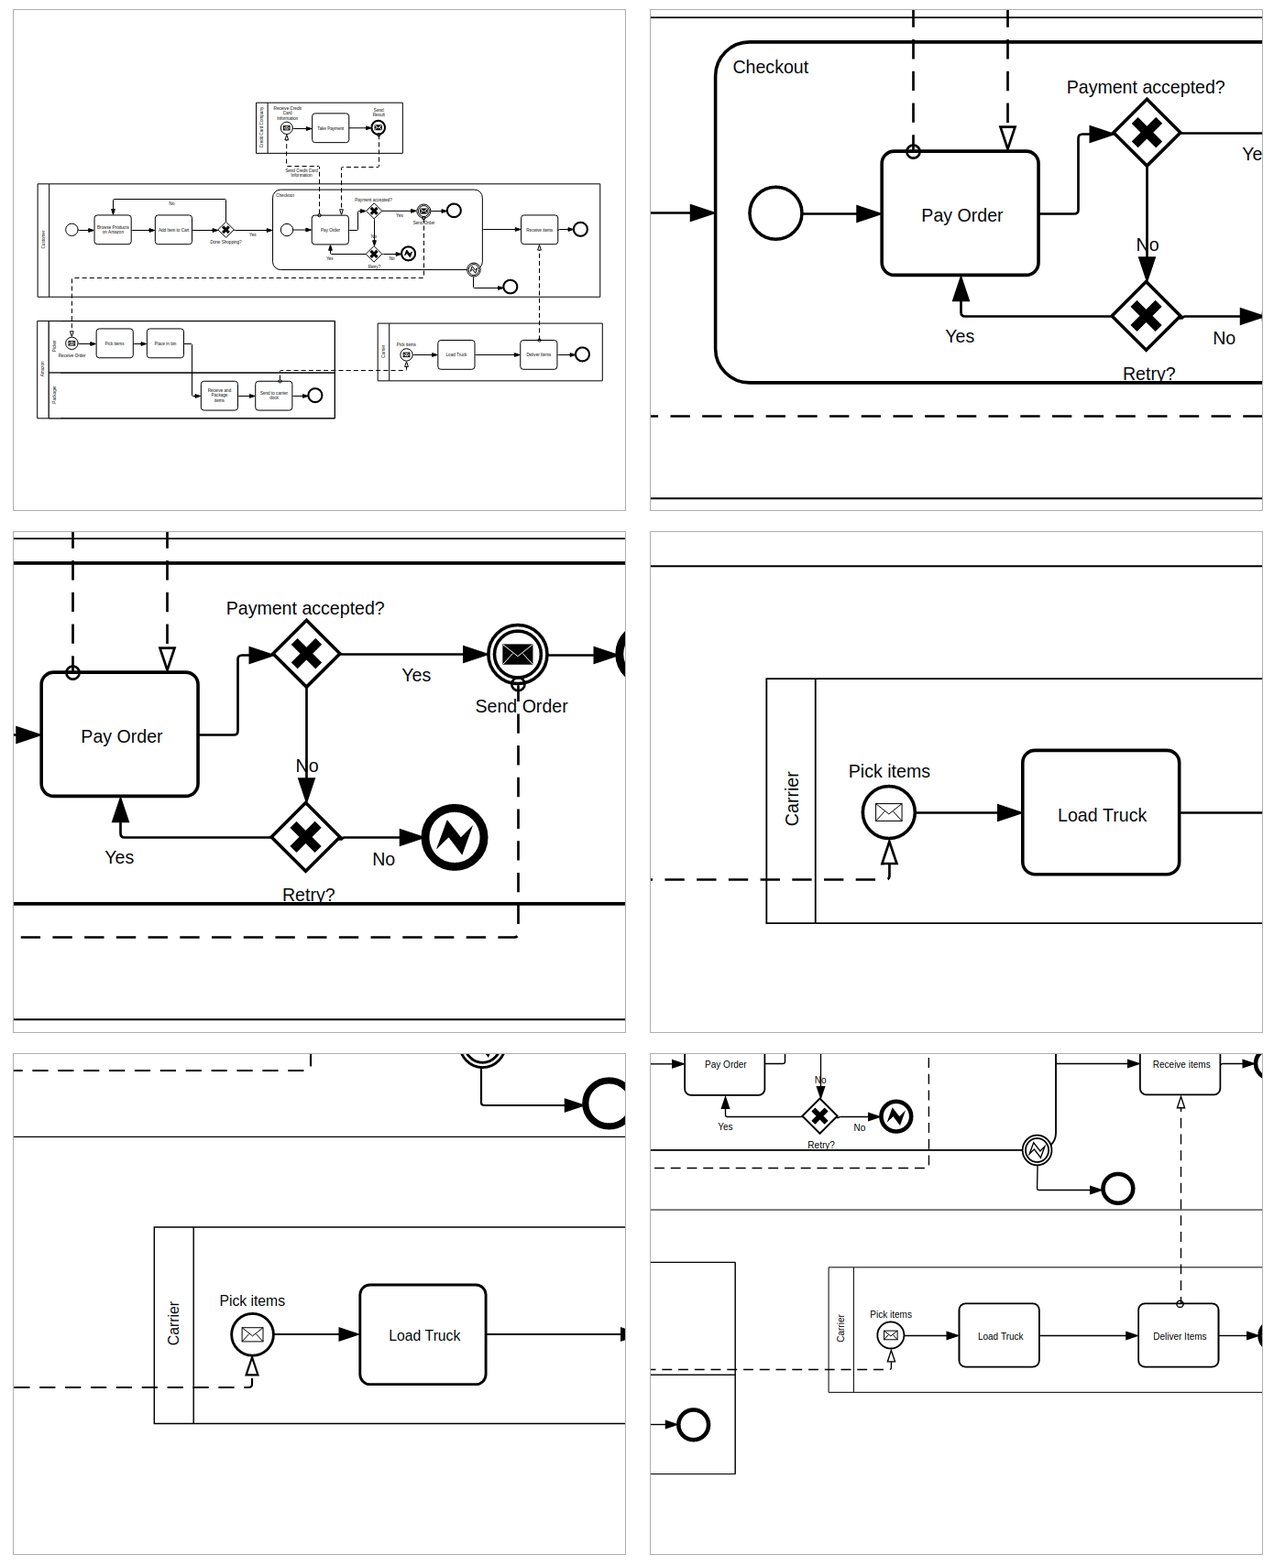
Navigation with the miwg-test-suite C.2.0 BPMN diagram
Theming
Colors, font, icons...everything can be customized. Here is an example we created to promote the Process Analytics project participation at HacktoberFest in October 2020.
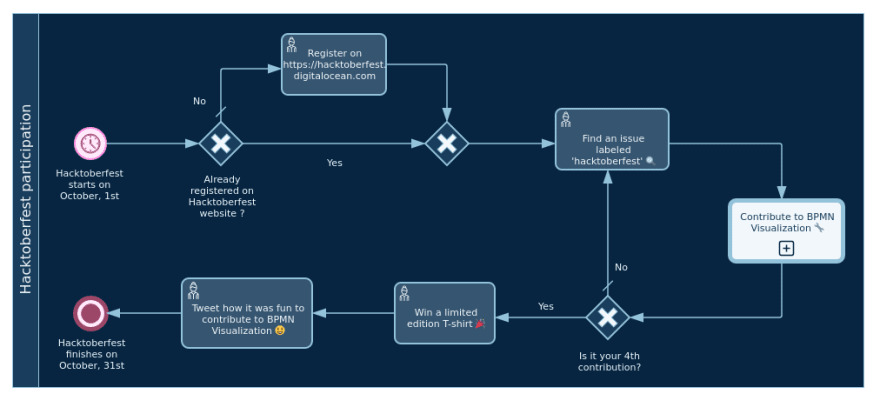
"Hacktoberfest Participation" process with the Hacktoberfest dark theme
Interacting with BPMN elements
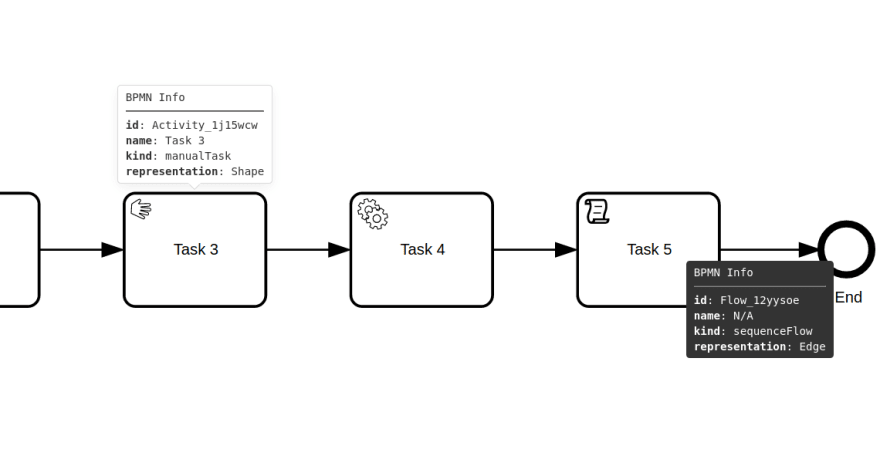
This custom example demonstrates how to let users interact with a BPMN diagram when clicking on a task, or passing the mouse over a transition between two elements.
In the following, we display BPMN information only, but you can use this feature to display execution data related to the current BPMN element: execution time and details, pending user of an activity, current error at this stage of the process, and more.
Display popovers on user interaction with the BPMN Diagram
Navigate between diagrams
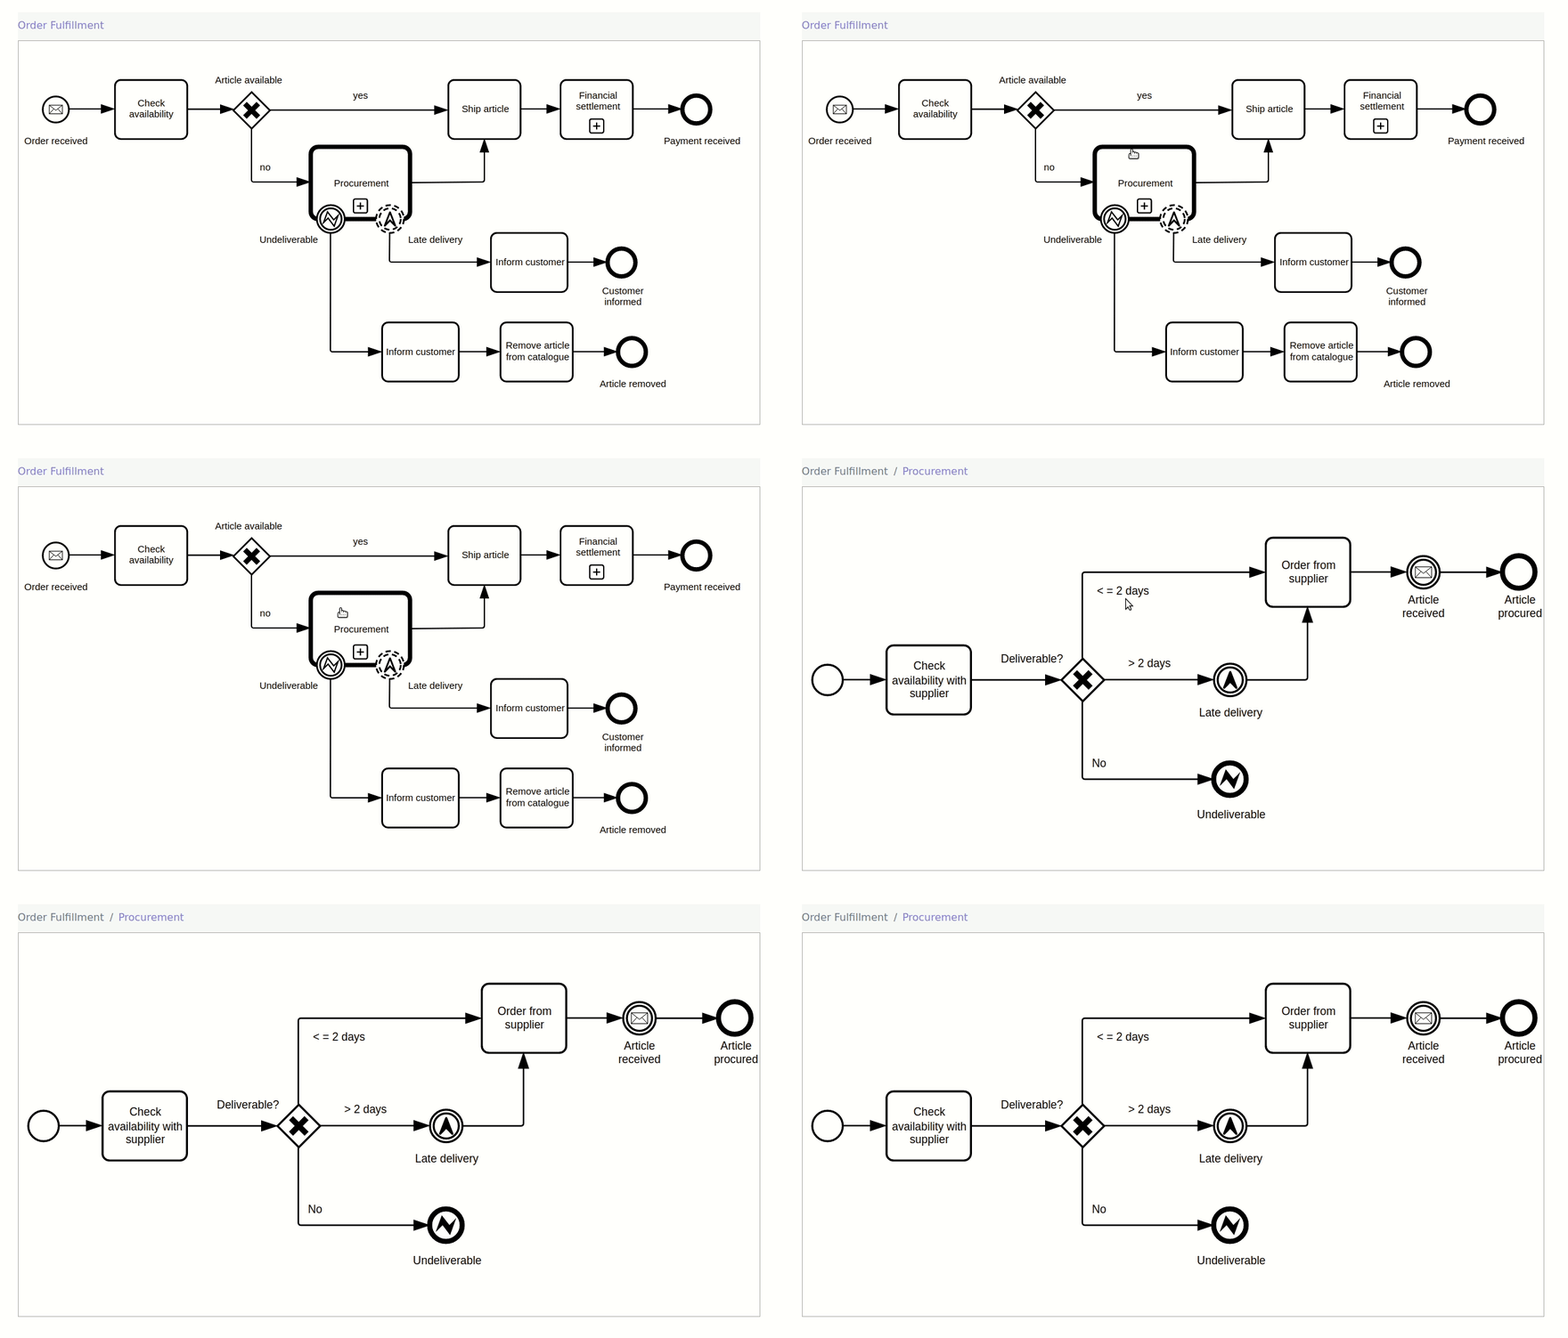
Here is another kind of interaction with BPMN elements. When your main process has a call activity, you can navigate back and forth between the main process and the call activity subprocess.
"Procurement Processes with Error Handling" diagram from BPMN 2.0 examples non-normative machine readable files
Path highlighting
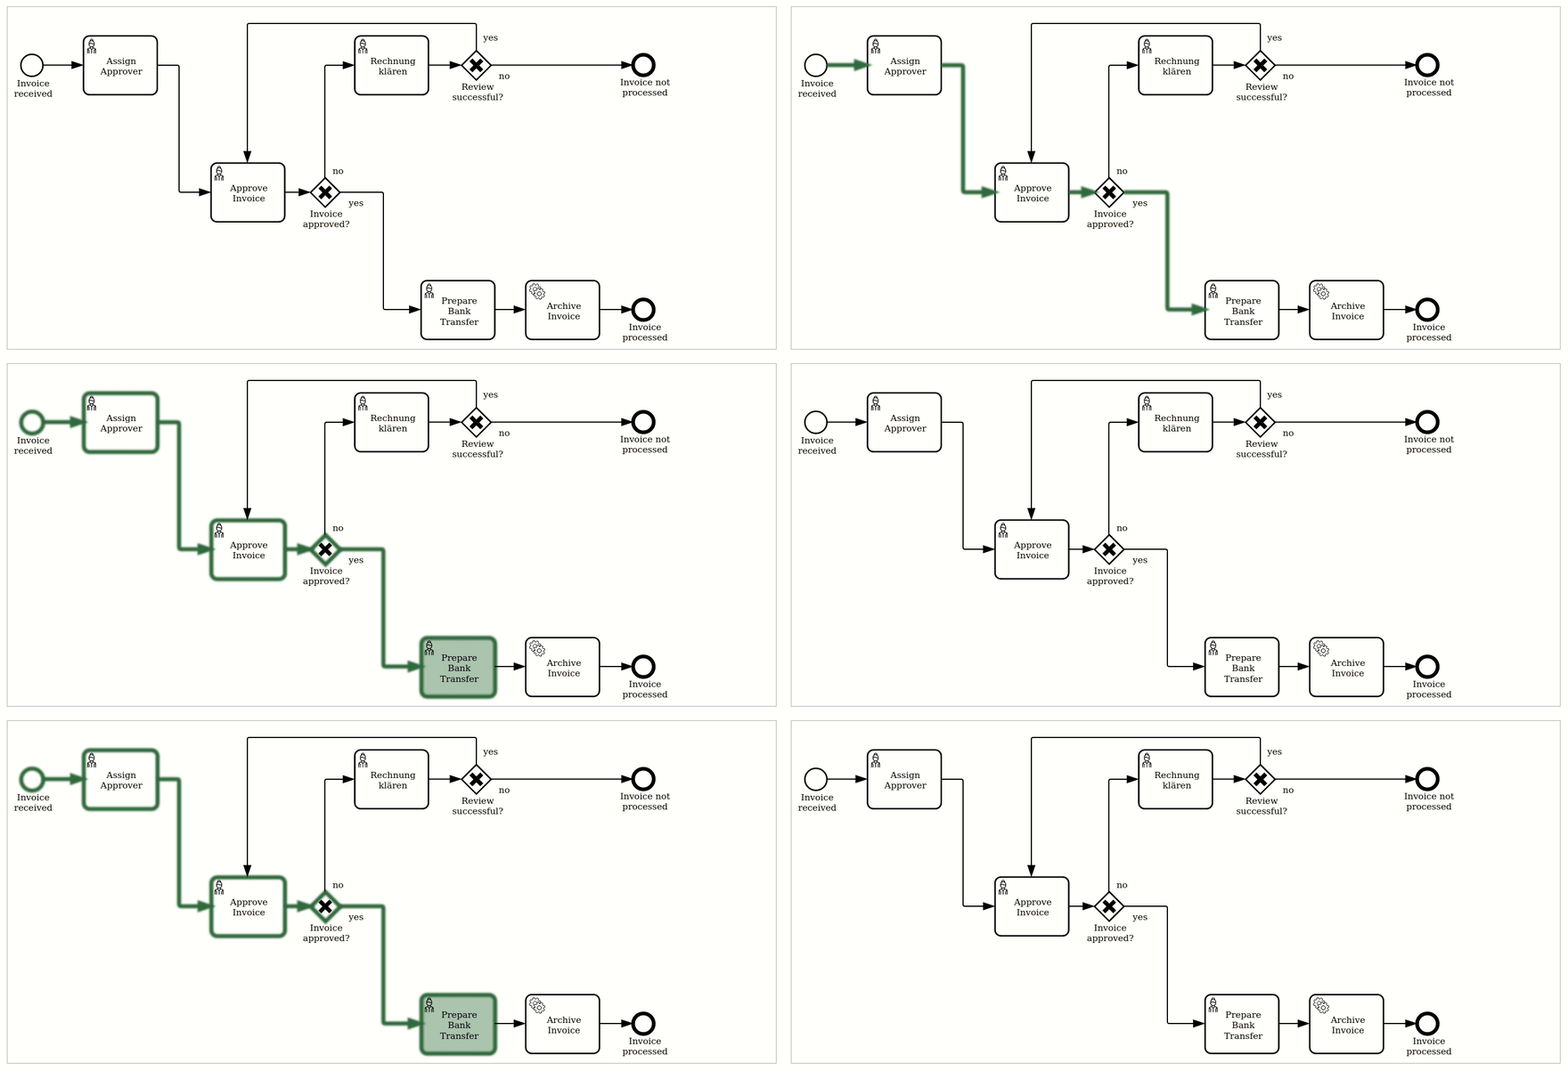
This custom example shows how to see which path in a process is the current running activity.
Path highlighting with the miwg-test-suite C.1.1 BPMN diagram
What next in 2021?
Now we are working on providing support to display process execution statistics, predictions, counters, badges (and much more) to aid monitoring, process optimization, and bottleneck detection scenarios for instance.
Visit our bpmn-visualization GitHub repository for more details and follow us on Twitter @ProcessAnalyti1 to stay up to date with news and releases.
This article was originally published at LinkedIn.

Posted on May 25, 2021
Join Our Newsletter. No Spam, Only the good stuff.
Sign up to receive the latest update from our blog.
