Build this Wi-Fi thermometer for your workshop using a Gen 3 Argon and a Grove Starter Kit

Jordy Moors
Posted on June 20, 2019

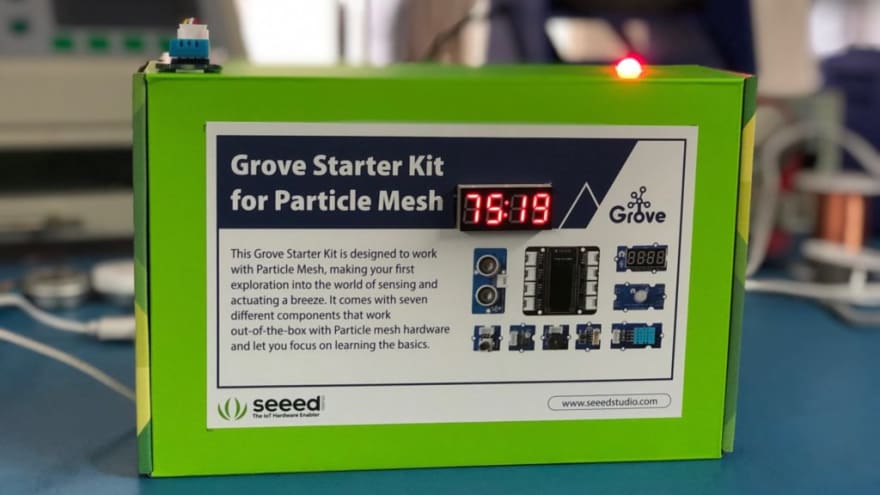
In this tutorial, you’ll make a simple Wi-Fi thermometer using the Particle Argon and the Grove Starter Kit for Particle Mesh. The goal is to measure the current temperature, display that value on a display, and an RGB LED to give a visual warning if the temperature crosses a predefined threshold. Thanks to the ease of use of the Grove system, this should be an accessible project even if you’re just starting out.
Required hardware
In order to follow along with this guide, you’ll need the following items.
- (1) Particle Argon — this project assumes you’ve set up your Argon. If you’ve not done that yet, follow the instructions here before you begin this project.
- (1) Grove Starter Kit for Particle Mesh — the kit comes with a number of different sensors. This project will use the follow parts from the kit:
- (1) Grove shield for Particle Mesh
- (1) temperature and humidity sensor
- (1) chainable RGB LED V2
- (1) 4-digit display
- (3) Grove wires
Hardware assembly
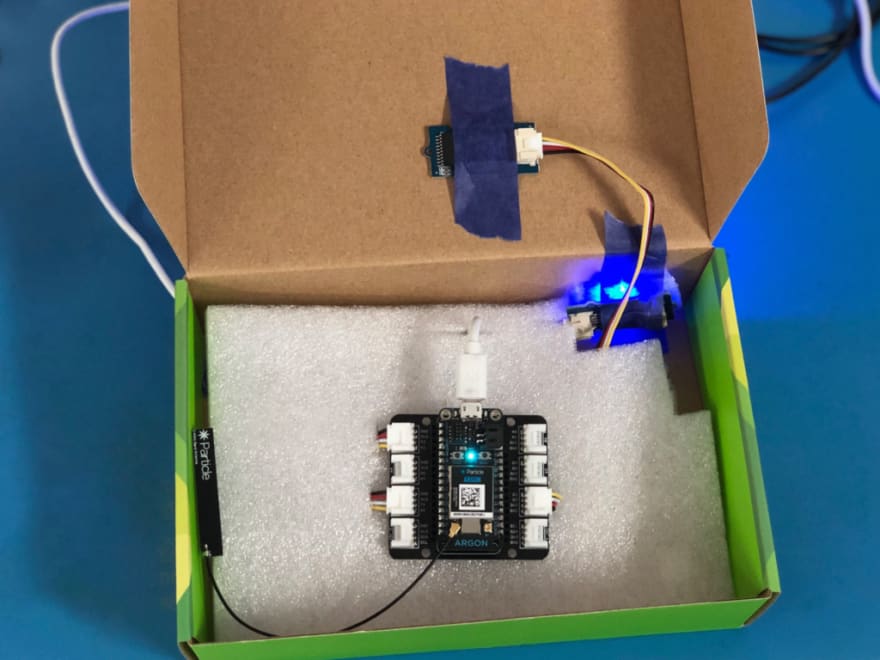
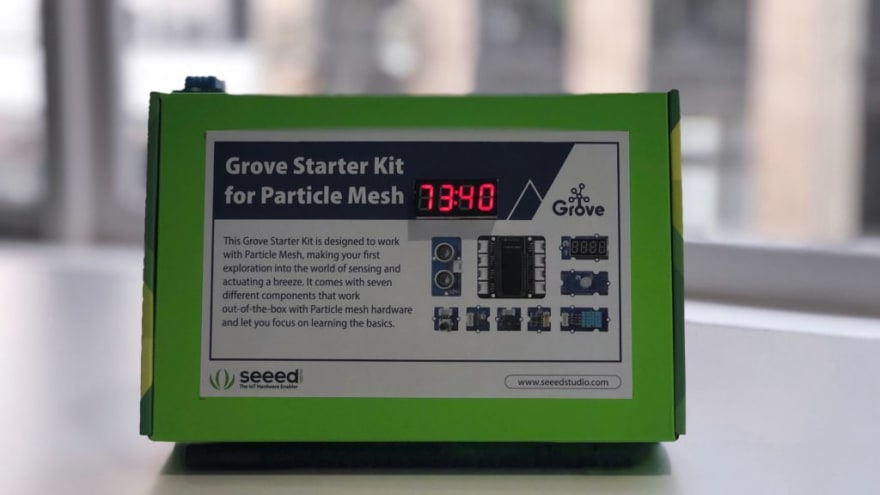
Assembly of the project requires zero soldering. In my build, I got a bit fancy and decided to repurpose the Grove kit box as an enclosure. I won’t cover the exact steps to build the enclosure, but will say that when you work with cardboard, measure twice and cut with several passes of your cutting tool.
Connect your Grove sensors

The main step in this project is to connect all the sensors to the Grove FeatherWing. Building with the Grove system is quick and efficient. Plus, each of the Grove wires are notched with a small piece of plastic, so it’s physically impossible to connect the Grove cables the wrong way. Here’s a chart for the connections I used in the project.
| Grove FeatherWing port | Sensor |
|---|---|
| D2 | 4-digit display |
| A2 | Temperature & Humidity sensor |
| UART | RGB LED |
Finally, add your Argon to the Grove FeatherWing and seat it snuggly. That’s it, all done with the physical build. Let’s get to the code.
Add code and you’ll be monitoring ambient temperature in no time
Even though assembling the hardware was rather trivial, your project won’t do much until you add code. Luckily, flashing your Argon isn’t overly complicated either. To make things even more streamlined, you can use existing firmware libraries for the Grove sensors and actuators, so you don’t have to start from scratch. Libraries are a great method to abstract away much of the code complexity. And by using the right libraries, you’ll basically only have to tie together the functions you want to use in your project, and add your own program logic.
Additionally, by clicking on this link, you’ll be taken to the Particle Web IDE with all of the code preloaded for you. All you’ll need to do is to duplicate the project.
Highlights from the code
While it’s convenient to duplicate the code and call the project done, it’s worth looking at some of the sections of the program logic to understand what’s is being run on your Argon.
Pre-setup: library includes and variable definitions
At the beginning of the code, you will see #include and #define declarations that specify the libraries used in the project and your pin configuration that is used for each sensor.
#include "Seeed_DHT11.h"
#include "TM1637.h"
#include "Grove_ChainableLED.h"
#define DHTPIN A2     // Temp&Humi pin
#define CLK D2    // 4-Digit Display pins
#define DIO D3
DHT dht(DHTPIN);    // Temp/&Humi object
TM1637 tm1637(CLK,DIO);    // 4-Digit Display object
ChainableLED leds(RX, TX, 1);     // LED object with respective pins
Getting your code in order with the Setup() function
The setup function is used to initialise your libraries and configure their objects with settings that you’ll use later on in your code.
void setup()
{
tm1637.init();    // initialize Display library
tm1637.set(BRIGHTEST);    // BRIGHT_TYPICAL = 2,BRIGHT_DARKEST = 0,BRIGHTEST = 7;
tm1637.point(POINT_ON);    // Enable 'decimal' points
leds.init();    // initialize LED library
dht.begin();    // initialize DHT library
}
Understanding the main code loop()
In a sketch, the loop() function is run continuously. So this is the section of the code where you want to put the main program logic of your project. At a high level, loop() polls data from the sensors, processes the data, and outputs it in an actionable way. Let’s dive in.
Measuring the temperature and humidity
The main data for this project comes from the temperature and humidity sensor attached to A2. The first thing to do is to verify that the sensor data valid. Should there be any invalid data, the code will use the Serial.println() to output, “Failed to read from DHT11 sensor!” and exit the the loop() function.
//Read Humidity
float h = dht.getHumidity();

// Read temperature as Celsius
float t = dht.getTempCelcius();

// Read temperature as Farenheit
float f = dht.getTempFarenheit();

// Check if any reads failed
if (isnan(h) || isnan(t) || isnan(f))
{
Serial.println("Failed to read from DHT11 sensor!");
return;
}
Processing the temperature and humidity measurements
If the data is valid, you’ll move on and separate the temperature data out in to individual numbers so they can be displayed on the 4-Digit display.
// Separate the temperature to individual numbers to be used on the display.
int int_number = f * 100.0; // Two digits after decimal are kept. Turn the number into integer
int digits[10];             //Just in case I have 8 digits before decimal
for (byte i=0; i<10; i++)
{
    digits[i]  = int_number % 10;
    if (int_number == 0)
        break;
    int_number /= 10;
}

// display the numbers on the display
tm1637.display(0,digits[3]);
tm1637.display(1,digits[2]);
tm1637.display(2,digits[1]);
tm1637.display(3,digits[0]);
Outputting the temperature and humidity readings
Up next, you’ll take the data you collected and push it out. Using both a serial connection as well as a Particle.publish() makes sure you can read it locally and remotely, respectively.
// Print the measured values over a Serial connection
Serial.print("Temp: ");
Serial.print(f);
Serial.println("*F ");
Serial.println();
Serial.println();

// Publis the temperature to the Cloud using Server Sent Events (SSE)
Particle.publish("tempF", String(f));
Changing the RGB LED color based on the temperature

The last bit of code is to control the color of the LED based on the current temperature. For this to work, the code uses conditional statements to evaluate if the current temperature is above or below 75F. If the temperature is above 75F, the RGB LED will turn red. If the temp is below that, the LED will illuminate blue. You can tweak the temperature thresholds simply by altering the 75.0 in the code. Try it out for yourself. You’ll need to reflash your Argon to see your new code in action.
/ Temperature warning. Over 75F -> red. Under 75F -> Cyan.
if (f > 75.0){
leds.setColorRGB(0, 255, 0, 0); // red
}
if (f < 75.0){
leds.setColorRGB(0, 0, 0, 255); // cyan
}
delay(1000);
The last line of this snippet is not to be overlooked. The line delay(1000) slows the execution of the loop() function down by 1000ms. I added this so the code doesn’t exceed the Particle.publish rate limit. Also, the sensor can’t read faster than 1000ms anyhow, so there’s no advantage in excluding the loop delay.
Know the temperature even when you’re not in the room with Particle.publish()
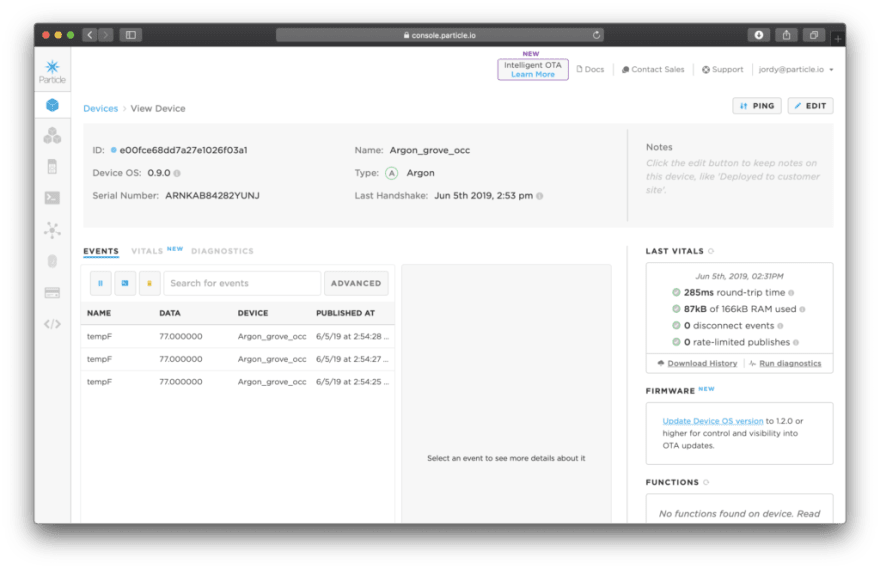
Provided you’ve followed the instructions correctly, you should now have a working thermometer with a local display. Thanks to the Particle.publish however, you can also see that temperature remotely by going to the Particle Console and selecting the device on the my devices tab or by checking the Events tab (where you will be able to see publishes from all your devices at once).
Customizing this project to suite your needs

Now you’ve got your project broadcasting data to the internet, you can take that data and act upon it. For inspiration, take a look at Hackster for some inspirational projects and ideas for how you can extend this project. For example, you could use an IFTTT recipe for Particle to automate an email to send when the room temperature exceeds your predefined max.
Be sure that however you modify this project, you share your work in the Particle forum and tweet your project photos at us.
The post Build this Wi-Fi thermometer for your workshop using a Gen 3 Argon and a Grove Starter Kit appeared first on Particle Blog.

Posted on June 20, 2019
Join Our Newsletter. No Spam, Only the good stuff.
Sign up to receive the latest update from our blog.
Related

June 20, 2019

