Mat
Posted on February 18, 2024

Grafana is fantastic, you can collect dozens of datasources and view them in dashboards. But what if you wanted to extend this to your own tool. Perhaps you're creating a mobile app for monitoring and alerting and thought that Grafana would be a great way to get a bunch of datasources for not much effort.
First things First.
Yes I'm aware that Grafana is open source but the method I used to find the API endpoints is far quicker than digging through hundreds of files in a codebase I'm not familiar with.
The plan
1. Get the dashboard json
Grafana dashboards are stored as json objects and are easily queryable via their API. Theres also documentation on doing just that. Easy stuff.
2. Figure out what api call is used to get data
Not as easy. This is not documented, so we'll have to inspect network requests using the browser to find the requests needed.
3. Combine step 1 and 2
I should be able to get the json for a dashboard and then make a request for the data without any hardcoding of parameters. If the Grafana client can do it, i can do it.
Setup
We'll need a Grafana service account and token to get started. This is easy and theres a guide for it.
Getting the dashboard json
If we look at a dashboard in Grafana. We'll see the uid in the url. Then a simple GET request to /api/dashboards/uid/<uid> will suffice.
For the sake of brevity, I've omitted most of the response. A small dashboard can easily be more than 1000 lines of json. We'll save this json for later.
{
    "dashboard": {
      "panels": [
        {
          "datasource": {
            "type": "prometheus",
            "uid": "c8f641f5-80c3-41e2-bf79-d307ae89cf8f"
          },
          "id": 1,
          "targets": [
            {
              "datasource": {
                "type": "prometheus",
                "uid": "c8f641f5-80c3-41e2-bf79-d307ae89cf8f"
              },
              "disableTextWrap": false,
              "editorMode": "builder",
              "expr": "page_requests_total",
              "fullMetaSearch": false,
              "includeNullMetadata": true,
              "instant": false,
              "legendFormat": "__auto",
              "range": true,
              "refId": "A",
              "useBackend": false
            }
          ],
          "title": "Panel Title",
          "type": "timeseries"
        }
      ],
      "time": {
        "from": "now-6h",
        "to": "now"
      },
      "title": "New dashboard",
      "uid": "bebca380-068d-463d-9c9c-1bb19cb8d2b3",
    }
  }
How does Grafana use that information to get data for a dashboard?
Lets look at the network requests to get some clues.
We can see that when refreshing the panel there are 2 network requests made. One for annotations and one for query, with the later one looking like the request we need to make. If we right click on the request we can copy it as a curl command. Once again I've removed all the fields we don't actually need.
curl 'http://localhost:3000/api/ds/query?ds_type=prometheus&requestId=Q105' \
  --data-raw '{"queries":[{"datasource":{"type":"prometheus","uid":"c8f641f5-80c3-41e2-bf79-d307ae89cf8f"},"disableTextWrap":false,"editorMode":"builder","expr":"page_requests_total","fullMetaSearch":false,"includeNullMetadata":true,"instant":false,"legendFormat":"__auto","range":true,"refId":"A","useBackend":false,"exemplar":false,"requestId":"1A","utcOffsetSec":39600,"interval":"","datasourceId":1,"intervalMs":30000,"maxDataPoints":568}],"from":"1708207962285","to":"1708229562285"}' \
  --compressed
So we've learnt 3 things.
- We need to make a call to
/api/ds/query?ds_type=prometheus&requestId=Q105 - Its a
POSTrequest - The request object is pretty complex
To get a better view of the request object, lets view it as json.
{
  "queries": [
    {
      "datasource": {
        "type": "prometheus",
        "uid": "c8f641f5-80c3-41e2-bf79-d307ae89cf8f"
      },
      "disableTextWrap": false,
      "editorMode": "builder",
      "expr": "page_requests_total",
      "fullMetaSearch": false,
      "includeNullMetadata": true,
      "instant": false,
      "legendFormat": "__auto",
      "range": true,
      "refId": "A",
      "useBackend": false,
      "exemplar": false,
      "requestId": "1A",
      "utcOffsetSec": 39600,
      "interval": "",
      "datasourceId": 1,
      "intervalMs": 30000,
      "maxDataPoints": 568
    }
  ],
  "from": "1708207962285",
  "to": "1708229562285"
}
It was at this point that I lost hope. How am i meant to create all those fields for each request, with other dashboards surely having different request objects, but thats when I noticed the similarity between the request object and the dashboard json. The queries array is actually just the targets array from the dashboard, and the from and to are timestamps.
Updated game plan
Ok so we know we need to get the dashboard json, then we'll extract out the targets array for a panel, then we'll build the request.
Extract the dashboard uid and panel id from a URL
This function will get the arguments we need from a grafana url.
func ExtractArgs(urlStr string) (string, int) {
    parsedUrl, err := url.Parse(urlStr)
    if err != nil {
        return "", 0
    }

    segs := strings.Split(parsedUrl.Path, "/")
    var uid string
    if len(segs) >= 3 {
        uid = segs[2]
    } else {
        return "", 0
    }

    viewPanel := parsedUrl.Query().Get("viewPanel")
    if viewPanel == "" {
        return "", 0
    }

    id, err := strconv.ParseInt(viewPanel, 0, 0)
    if err != nil {
        return "", 0
    }

    return uid, int(id)
}
Filtering the panels until we find the one we want. then grabbing the targets array.
for i := range dashboard.Dashboard.Panels {
    p := dashboard.Dashboard.Panels[i]
    if p.ID != panelID {
        continue
    }
    targets = append(targets, p.Targets...)
}
Building the request
endTime := time.Now().Unix() * int64(1000)
startTime := start.Unix() * int64(1000)

request := GrafanaDataQueryRequest{
    Queries: targets,
    From:    fmt.Sprint(startTime),
    To:      fmt.Sprint(endTime),
}

b, err := json.Marshal(&request)
if err != nil {
return result, fmt.Errorf("failed to build request object %v", err)
}

query := fmt.Sprintf("%v://%v/api/ds/query", c.baseURL.Scheme, c.baseURL.Host)
req, err := c.NewRequest(http.MethodPost, query, bytes.NewBuffer(b))
From this point on I'll using the package I created grafanadata.
We can simply paste in a URL for a dashboard and it will spit out the raw data for a panel
package main

import (
    "encoding/json"
    "log"
    "os"
    "time"

    "github.com/mperkins808/grafanadata/go/pkg/grafanadata"
)

func main() {

    u := "http://localhost:3000/d/bebca380-068d-463d-9c9c-1bb19cb8d2b3/new-dashboard?orgId=1&viewPanel=2"
    t := "glsa_5N21WQvXza0oWkbqQvjOhII8yJYxGS0G_fbb82943"
    client, err := grafanadata.NewGrafanaClient(u, t)

    if err != nil {
        log.Fatal(err)
    }

    start := time.Now().Add(time.Hour * 24 * -7)
    data, err := client.GetPanelDataFromURL(u, start)

    if err != nil {
        log.Fatal(err)
    }

    log.Default().Println(data)

    b, _ := json.Marshal(&data)
    os.WriteFile("data.json", b, 0644)
}
The results
This panel produced a json file 4000 lines long, heres the important parts. I've also included a grafanadata.ConvertResultToPrometheusFormat() function to convert the grafana response into a prometheus format, this is 1/4th the size and I prefer this format.
{
      "status": 200,
      "frames": [
        {
          "schema": {
            "fields": [
              {

                "labels": {
                  "__name__": "go_memstats_alloc_bytes",
                  "instance": "cronus-saas:4000",
                  "job": "cronus-saas"
                }
              }
            ]
          },
          "data": {
            "values": [
              [
                1707732000000, 1707739200000
              ],
              [
                4493296, 3634360
              ]
            ]
          }
        }
      ]
    }
How I actually use this package
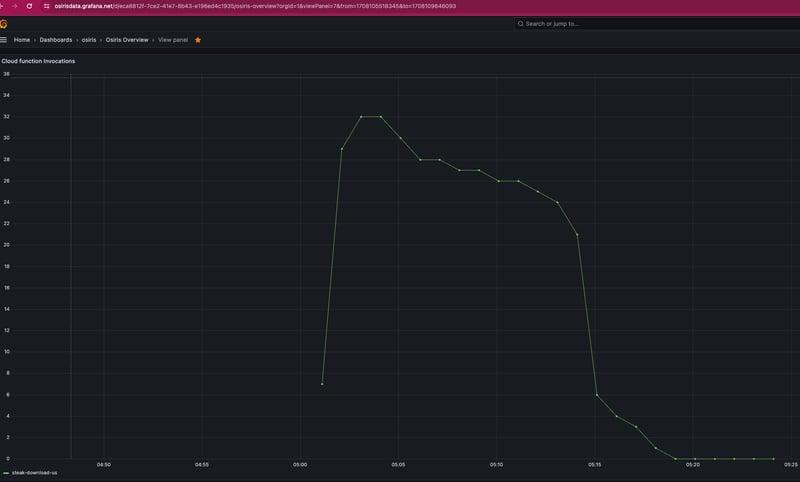
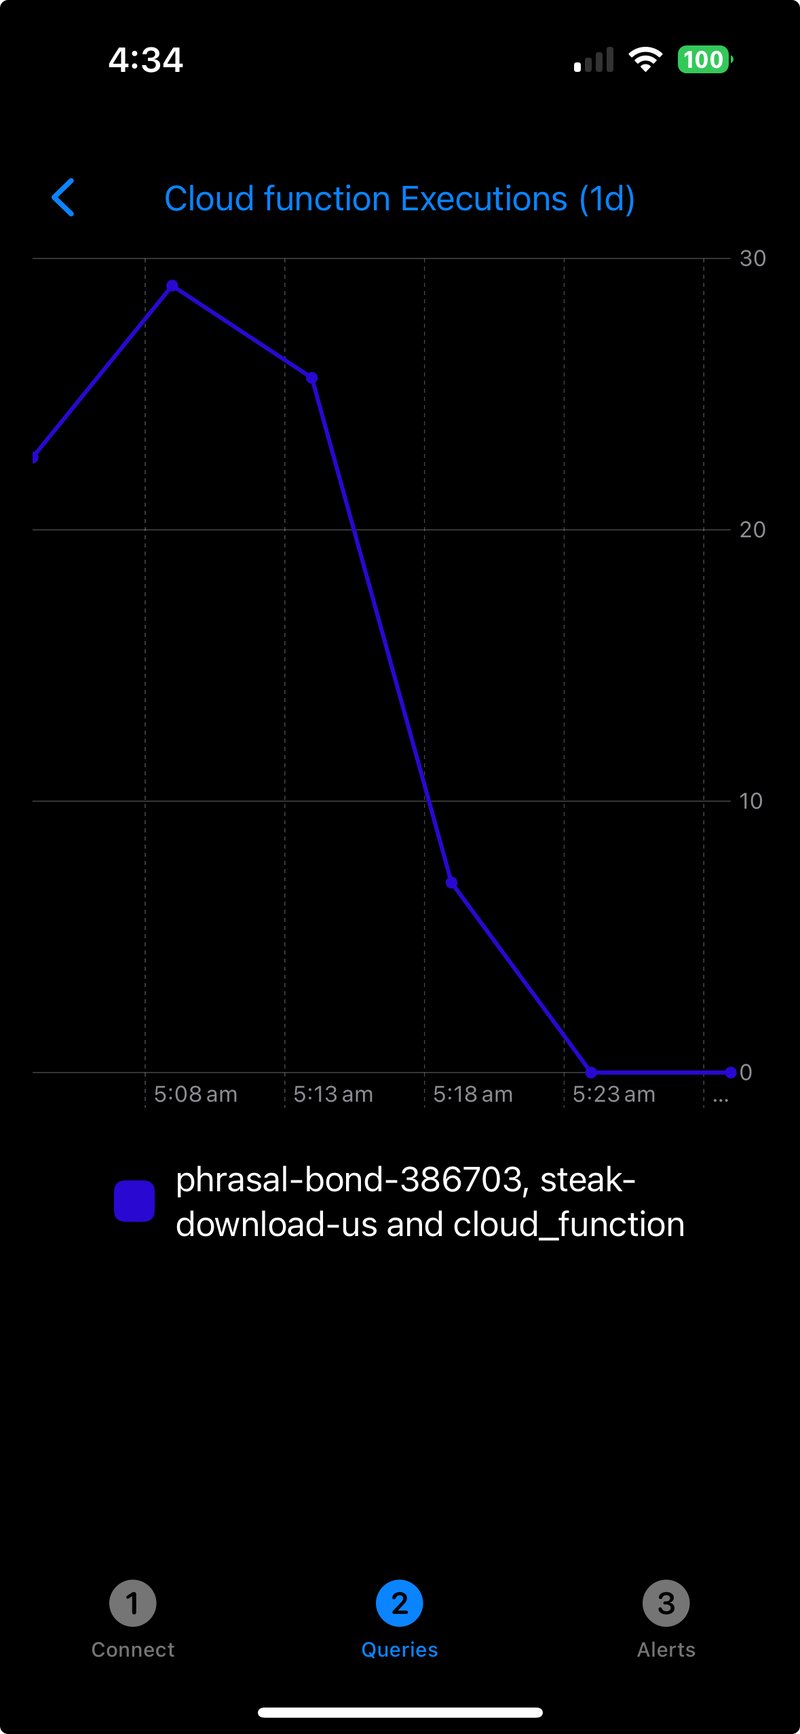
As i mentioned at the top. I'm creating a mobile app for monitoring and alerting and wanted to add Grafana as a datasource. Users can simply copy and paste their Grafana URL and their metrics will be avaliable.
Viewing the metrics on the App

Posted on February 18, 2024
Join Our Newsletter. No Spam, Only the good stuff.
Sign up to receive the latest update from our blog.


