Reliable Application Deployments in a GitOps Setup with Flagger

Florian Heubeck
Posted on January 30, 2024

The ultimate goal of every GitOps setup is complete automation. For a reliable, headless application rollout, the perfect supplement to our Flux managed Kubernetes resources is Flagger. In this blog, you will learn how to not worry about application deployments at any time, even on Fridays.
This article is the second of two accompanying articles to my talk about this topic on the Mastering GitOps conference.
Having continuous delivery in place means, that new versions (that passed the fully automated continuous integration (CI), of course) automatically get deployed - ideally also to production.
In the related blog article about how to monitor and harden the GitOps setup itself, our goal was to reduce risk of failure and build alerting for actual errors, so that no one has to actively monitor the rollout of changes.
All of this already relaxes operation, but anyhow we may be forced to react immediately to mitigate customer impact in case of an incident.
In this way, we want to protect our business applications even better against failures caused by changes.
There are lots of deployment strategies out there to ensure smooth changes and early problem discovery - and for applying them in our Kubernetes GitOps setup in an automated way, we're using Flagger.
Deployment sources of error
A typical business application may fail in production for mainly two reasons:
- Configuration errors
- Software problems
The first is obvious: Configuration is different for each environment. And most of the time, an application will face the production config first when hitting production. Adopting GitOps properly, your application configuration is hold under version control and passes the four-eyes-principle before getting applied - this reduces risk of error considerably.
Software problems indeed should be discovered far before production, you would say. True, for sure. But true as well is, that there's no place comparable with production. Data, stored and (possibly) migrated over years or decades. Traffic profiles or event series, impossible to create artificially during CI. And of course: Users. Creative and ingenious. Say no more, we're all doing our best to ensure quality, but we have to handle the unforeseeable.
When doing changes to our systems, we should apply them carefully, maybe run some validations and possibly even give them a circumspect try before rolling out completely.
Application shadows
So far, I probably haven't told you anything new. The relevant part is, that we don't want to do any of that manually. Why investing in universal automation, but risking the most important step to fail, requiring manual remediation.
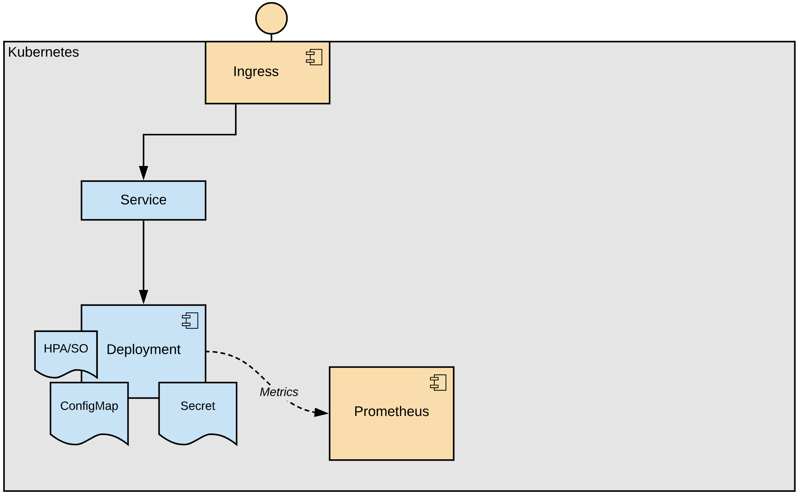
Let's have a look to a typical setup in our context:
There's a deployment wrapping our business application, ConfigMap and Secret are mounted for injecting configuration. Most likely there's a HorizontalPodAutoscaler (HPA) or a ScaledObject (SO) definition as well.
The application publishes metrics, scraped by Prometheus, and of course there are metrics available from the ingress and Kubernetes itself as well.
On every update on the deployment declaration, Kubernetes runs a rolling update by default. That means, new pods are created and when they become ready, old pods are terminated. The insurance for well-being of the software has to be built into the health probes.
When configuration changes, its application depends on the way it's used. Environment values only change on pod creation or restart. File mounts are actually updated ad-hoc, but the application also needs to re-initialize them.
Since our application manifests are anyhow packaged as Helm chart, we can trigger a re-deployment on configuration change by annotating checksums of ConfigMap and Secret into the pod template of our deployment:
apiVersion: apps/v1
kind: Deployment
spec:
  template:
    metadata:
      annotations:
        checksum/config: {{ include (print $.Template.BasePath "/configmap.yaml") . | sha256sum }}
        checksum/secret: {{ include (print $.Template.BasePath "/secret.yaml") . | sha256sum }}
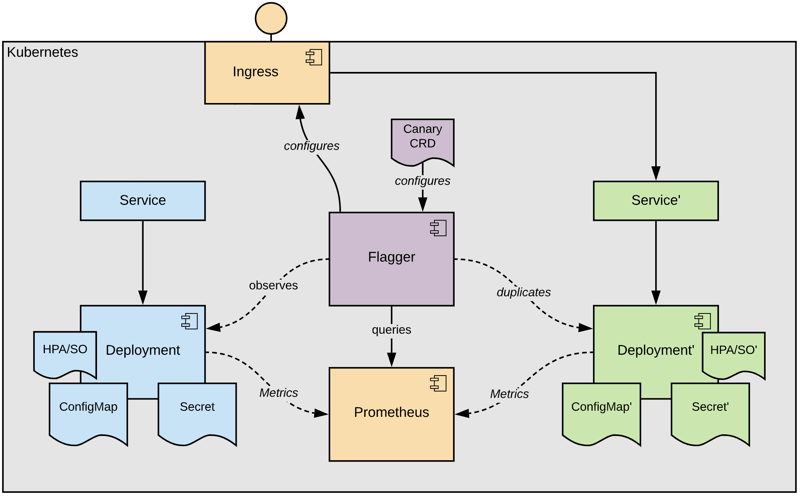
Now, we're prepared for introducing Flagger. Flagger is configured by a so called Canary CRD that instructs it to care about a defined target, in our case the deployment:
Basically, Flagger duplicates this target, its mounted resources and autoscaler objects referenced by the Canary CR.
Eventually, when the copy became ready, Flagger instructs the Ingress to route the traffic to the copy, the so called "primary" deployment.
The last step of this initialization phase is to scale down the original deployment, now called "canary".
This seems to be very complicated, what do we gain from it?
First of all some psychological safety 😉 - all the traffic targeting our application hits a copy of our original definition. Changing the definitions has exactly zero immediate impact to our users. And don't worry, the complexity will disappear as it's transparently handled by Flagger.
The cycle of deployment life
Are you aware on how heavily frequented road or rail bridges are replace? There's a new bridge created alongside the old one and the traffic shifted over after it's complete.
The additional bridge might be a temporary one, to free up the old bridge for their reconstruction.
This is exactly how Flagger works.
On changes to the Kubernetes manifest of our Deployment, Flagger reacts by scaling it up, wait for it to get ready and runs predefined actions.
These actions are basically HTTP calls along the process of rollout. With that, Flagger can trigger for instance automated tests, validating the new deployment. And it's not only firing these webhooks, but interpreting the response code. Flagger will not proceed with the next step of the rollout, if configured webhooks did not succeed.
We're using those webhooks for request generation on non-production environments to simulate application upgrade under load.
Of course not every application is only serving requests but doing batch processing or connecting to event sources. Also these kind of deployments can be progressively rolled out using Flagger. As requests cannot be routed by modifying Ingress rules in this case, Flaggers webhooks have to be used for guiding the application through the deployment lifecycle.
Eventually, Flagger will synchronize its copy of the Kubernetes resources, completing the rollout, and scale down our deployment of origin again. This deployment strategy is referred to as blue/green and already lets us sleep very well, hence any issue with the change to be rollout out, will cause an abortion, no users will be impacted.
There are metrics provided from Flagger reporting the state of all Canary definitions, which we can use for alerting: flagger_canary_status.
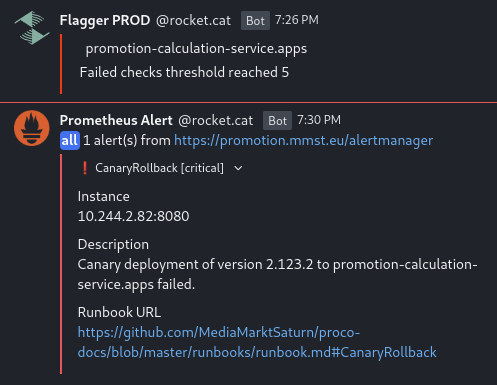
We've configured a PrometheusRule that triggers a chat message containing some useful information about the failed deployment:
As you can see, there is also a notification from Flagger itself included, as it can not only trigger webhooks, but also "alert" humans.
The "CanaryRollback" rule is defined as follows and uses some custom metrics of our application to provide more details (yeah, we're proud of that PromQLs 😇):
---
apiVersion: monitoring.coreos.com/v1
kind: PrometheusRule
spec:
  groups:
    - rules:
        - alert: CanaryRollback
          expr: flagger_canary_status > 1
          for: 1m
          labels:
            severity: critical
          annotations:
            summary: "Canary failed"
            description: >
              Canary deployment of version
              {{ with query (printf "max_over_time(promotion_service_major_version{job=\"%s-canary\"}[2h])" $labels.name) }}{{ . | first | value | humanize }}{{ end }}.{{ with query (printf "max_over_time(promotion_service_minor_version{job=\"%s-canary\"}[2h])" $labels.name) }}{{ . | first | value | humanize }}{{ end }}.{{ with query (printf "max_over_time(promotion_service_patch_version{job=\"%s-canary\"}[2h])" $labels.name) }}{{ . | first | value | humanize }}{{ end }}
              to {{ $labels.name }}.{{ $labels.exported_namespace }} failed.
            canaryVersion: '{{ with query (printf "max_over_time(promotion_service_major_version{job=\"%s-canary\"}[2h])" $labels.name) }}{{ . | first | value | humanize }}{{ end }}.{{ with query (printf "max_over_time(promotion_service_minor_version{job=\"%s-canary\"}[2h])" $labels.name) }}{{ . | first | value | humanize }}{{ end }}.{{ with query (printf "max_over_time(promotion_service_patch_version{job=\"%s-canary\"}[2h])" $labels.name) }}{{ . | first | value | humanize }}{{ end }}'
            primaryVersion: '{{ with query (printf "max(promotion_service_major_version{job=\"%s-primary\"})" $labels.name) }}{{ . | first | value | humanize }}{{ end }}.{{ with query (printf "max(promotion_service_minor_version{job=\"%s-primary\"})" $labels.name) }}{{ . | first | value | humanize }}{{ end }}.{{ with query (printf "max(promotion_service_patch_version{job=\"%s-primary\"})" $labels.name) }}{{ . | first | value | humanize }}{{ end }}'
The proof of the pudding is in the eating
Our updated application seems to feel quite well in production by now, but why throw it into the cold water of production traffic.
As you may have guessed from the CRD name "Canary", Flaggers main purpose is the automated progressive rollout of applications.
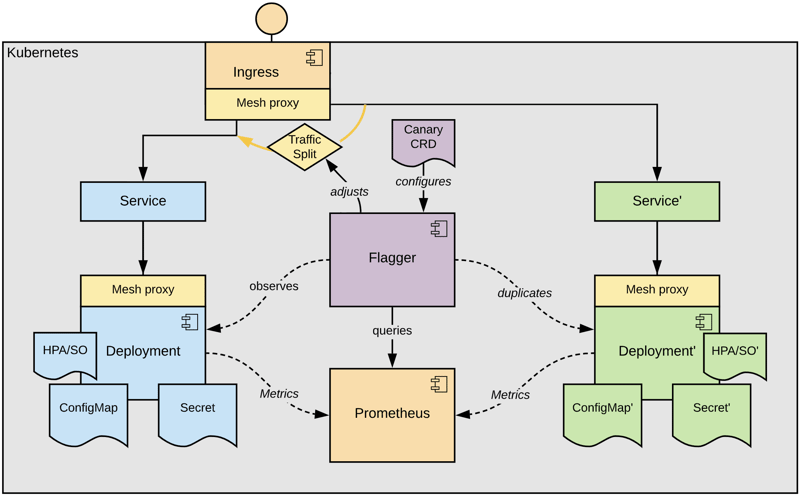
For making use of that functionality best, let's give Flagger fine grain traffic control by adding a service mesh:
Flagger supports all major service mesh implementations and can also perform progressive rollouts using the most common ingress gateways. I've created a playground setup using Linkerd some while ago, which gives a first hands-on experience in an easy way.
With a service mesh or an ingress gateway supporting weighted routing, Flagger can route sparse traffic to our updated canary deployment and increase the amount stepwise according to the Canary definition. But Flagger not only opens the floodgates slowly, giving our new deployment a chance to warm up, it also cares about our applications' wellbeing.
Flagger analyses metrics provided by the service mesh or the ingress gateway to decide for further rolling out the new application, or better rolling back. Lots of metric definitions are already built in, and selected according to the chosen mesh or ingress implementation, but custom metrics can easily be considered as well.
If there are issues with the changed canary version, only a little amount of requests are affected, and according to the configured analysis configuration, it's rolled back quickly.
The key is, to properly express the relevant aspects in metrics, by the application itself, but also from infrastructure components like databases (e.g. open connections) and especially service mesh or ingress components, that can provide the client view on your application.
Depending on how you consider your application working great, business metrics from the application could make sense, but also comparing metrics like "the updated application must not be slower than the old one", within some tolerance:
---
apiVersion: flagger.app/v1beta1
kind: MetricTemplate
metadata:
    name: request-duration-factor-pfifty
spec:
    provider:
        type: prometheus
        address: http://prometheus-operated.monitoring:9090
    # Factor of P50 request duration canary to primary
    query: |
        histogram_quantile(0.50,
          sum(
            irate(
              istio_request_duration_milliseconds_bucket{
                reporter="destination",
                destination_workload_namespace="{{ namespace }}",
                destination_workload="{{ target }}"
            }[{{ interval }}]
        )) by (le))
        /
        histogram_quantile(0.50,
          sum(
            irate(
              istio_request_duration_milliseconds_bucket{
                reporter="destination",
                destination_workload_namespace="{{ namespace }}",
                destination_workload="{{ target }}-primary"
            }[{{ interval }}]
        )) by (le))
---
apiVersion: flagger.app/v1beta1
kind: Canary
spec:
  analysis:
    metrics:
      - name: p50-factor
        templateRef:
          name: request-duration-factor-pfifty
        thresholdRange:
          max: 1.1
Everything is better in graphics
In the beginning, I said, no one wants to observe changes getting rolled out well, but rely on automation and alerting.
Call me a pretender, but even with all of this in place, and the confidence nothing bad will happen, I still like to watch changes getting introduced to production:
These Grafana panels visualize, how traffic gets shifted from the primary deployment (Flaggers copy of the previous version) - above the zero-line, to the updated canary deployment - below the zero-line, and back.
We were asked, why not interchanging roles of primary and canary after the traffic got shifted completely. We're not aware of an official statement by the Flagger team, but my guess is: For simplicity. For being able to having the canary become the primary after successful analysis, another abstraction would be required. The way Flagger works allows us, to just work with the plain Kubernetes app resources.
As you see in the traffic weight panel above, we shift 100% of the traffic to the canary before Flagger synchronizes its primary copy. This is not necessary and can be done at any weight - but it gives use some benefits:
- No sudden traffic impact on the newly created pods of the updated primary deployment
- Slow warm up of the pods, either implicit (built-in) or explicit (using Flagger webhooks)
- Better resource utilization
Some words about the latter: Lets assume our application has a high resource demand, because it's heavily scaled out. During a Canary rollout, this demand would double, what might be a waste of resources, or even not possible because of a restricted cluster size. With separate autoscaling configurations (HPA/SO), the canary can extend its resource demand during the traffic shift, whereas the primary can shrink. This way the overall resources don't exceed the standard Kubernetes rolling upgrades.
Sleep well
When starting with Flagger, you need to be aware that the new and the old versions of your application will run in parallel for some time and that both will handle traffic or process data.
This can cause issues with database schema updates or server-side client state. Flagger supports conditional traffic routing like for A/B testing, but you might be restricted in which extend you do progressive rollouts.
Regarding database or API schema changes: During a default Kubernetes rolling upgrade, new and old application versions are running also in parallel, this holds the exact same issues, albeit in a shorter time frame.
Another variation of progressive delivery especially for frontend applications, where randomly providing new and old application version may have user impact, can be achieved using session affinity. In this configuration, Flagger will use cookies for sticking to the new application version once a user hit it.
By now, there's no support for StatefulSets in Flagger, but it is considered. This might extend the opportunities of adopting Flagger to more picky workloads like databases.
Retrospectively, Flagger already saved us from some outages, and there are lots of ideas to explore on how to adopt it to non-classic request/response driven workloads. In any case we are reckless to commit changes in the Friday evening.
get to know us 👉 https://mms.tech 👈

Posted on January 30, 2024
Join Our Newsletter. No Spam, Only the good stuff.
Sign up to receive the latest update from our blog.


