May
Posted on July 25, 2020
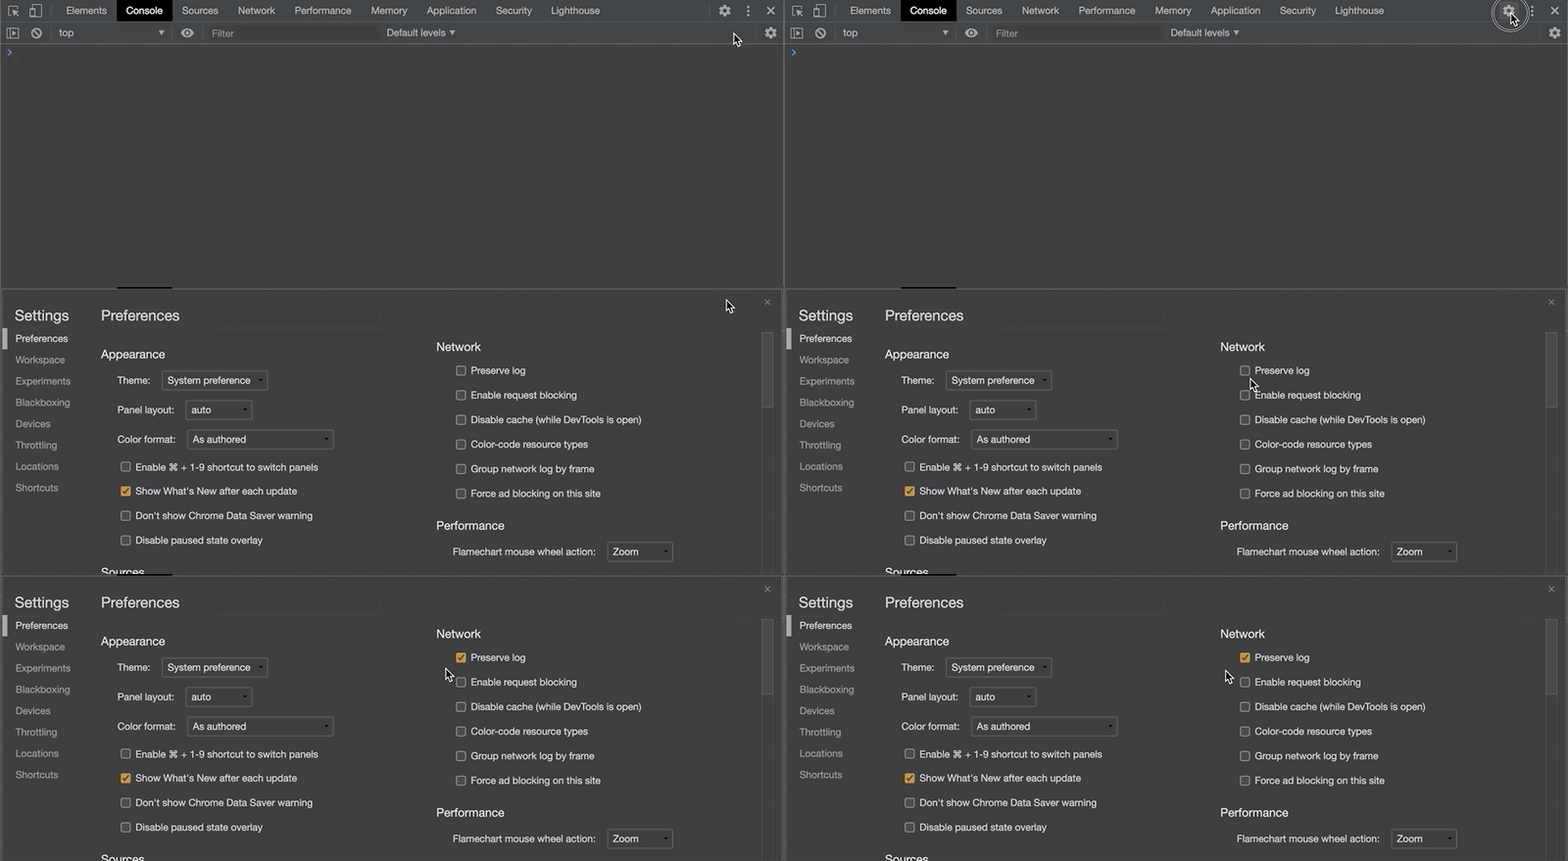
Preserve Log
Imagine you have a bug that causes a page to reload. Every time the bug gets triggered you lose all your logs and have no idea where to start debugging.
This function maintains a record of logs in the Console even after reloading. Go to Settings and then check "Preserve Logs" to activate it.
Tip: Run Clear console (Ctrl + L or Cmd + K) when you’re done debugging.
Debug on DOM Modifications
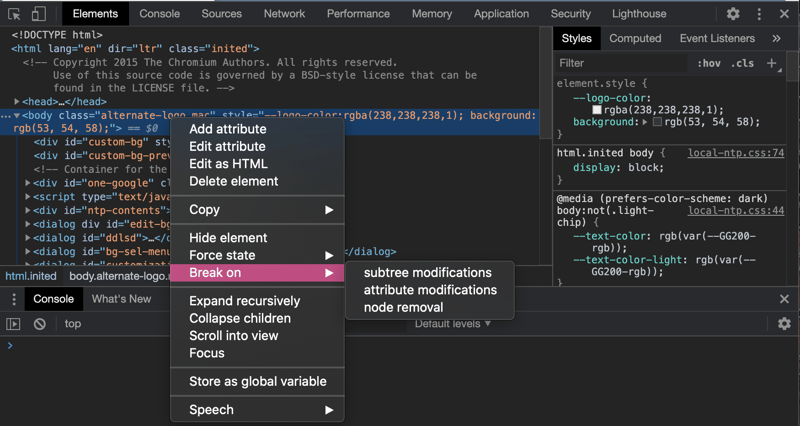
There are situations where you want to notice changes on a specific element to inspect what’s happening. To trigger a break when a DOM element changes, right-click on an element and then select one of the next:
Subtree modifications: Breaks when a script modifies the selected element’s children.
Attribute modifications: Breaks when an attribute is added to the selected element.
Node removal: Breaks when the selected element is removed.
Screenshots
Taking a screenshot using DevTools is quicker than opening an external application to capture your screen, especially when you can choose between capturing a selected area, full-size page, a specific node, or just your viewport.
Access this menu using Ctrl + Shift + P (or Cmd + Shift + P in Mac), then type “Screenshot” and select your desired option.
Reference a selected element in the Console
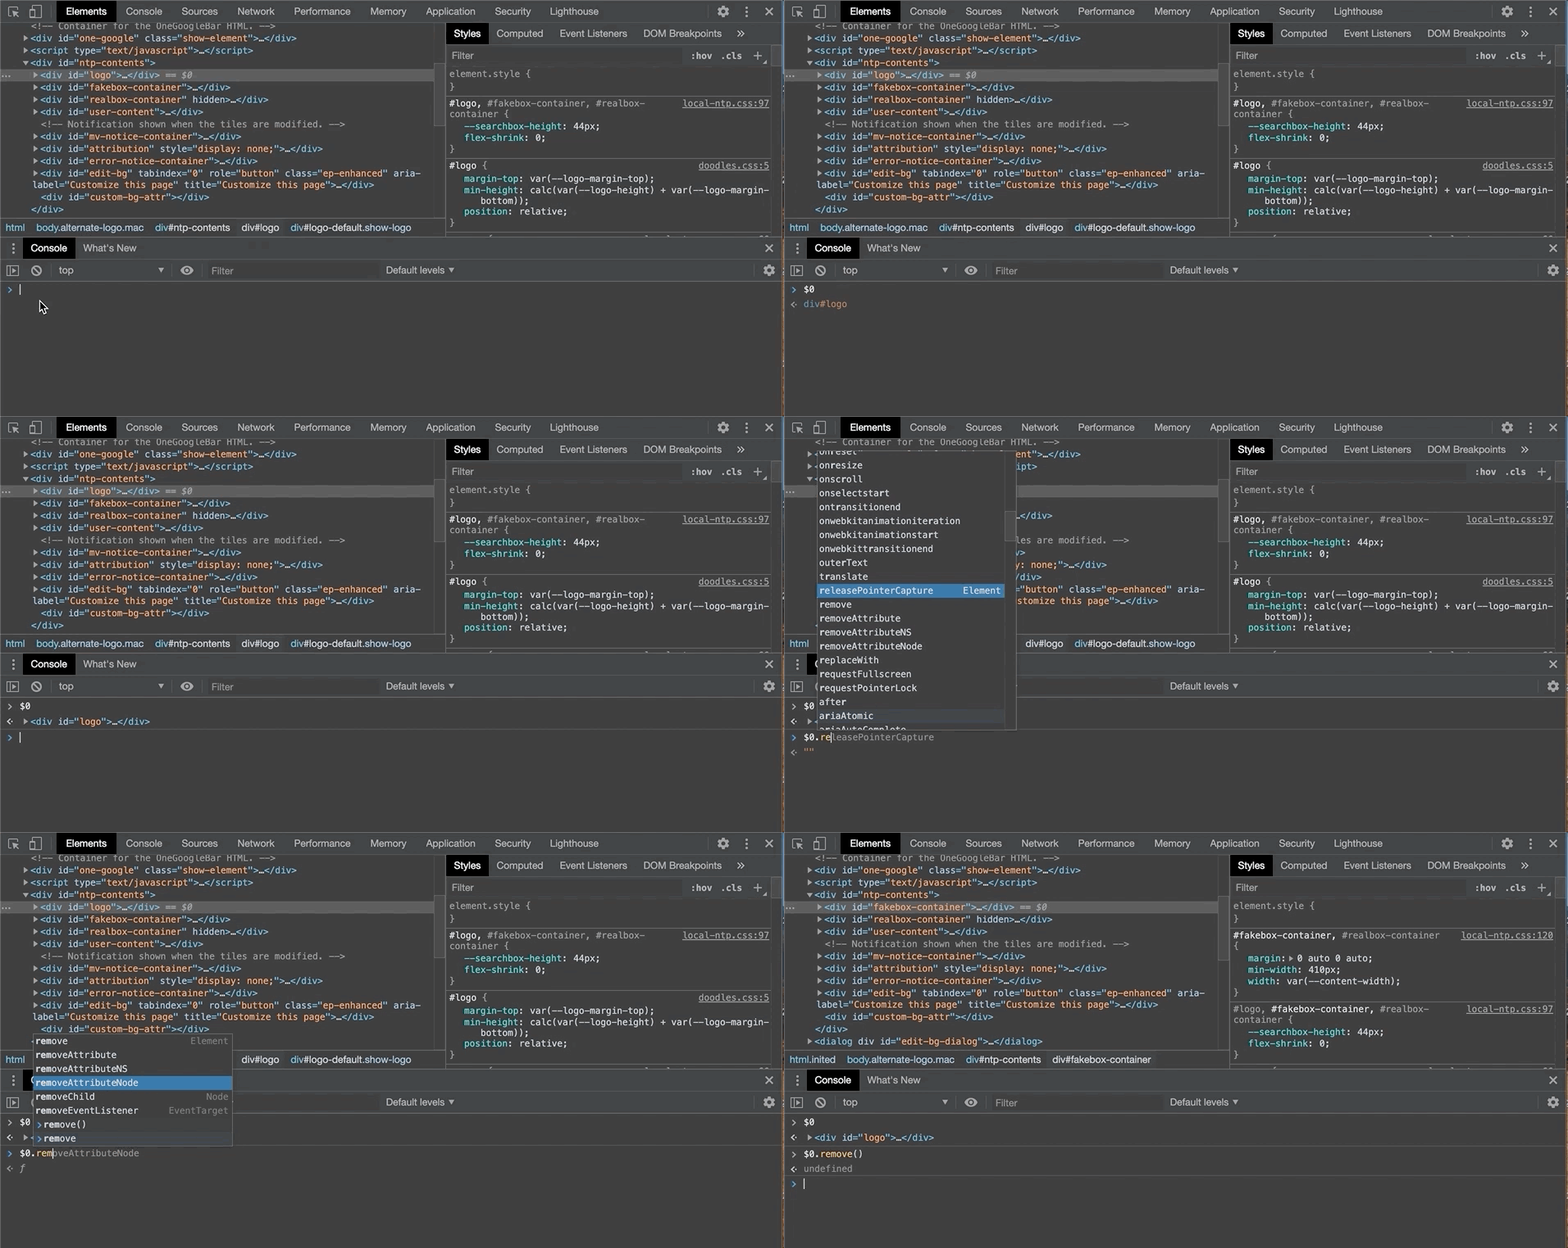
In the Elements tab, select an element you want to reference in the Console, then go back to the Console tab and type $0.
Show Rendering
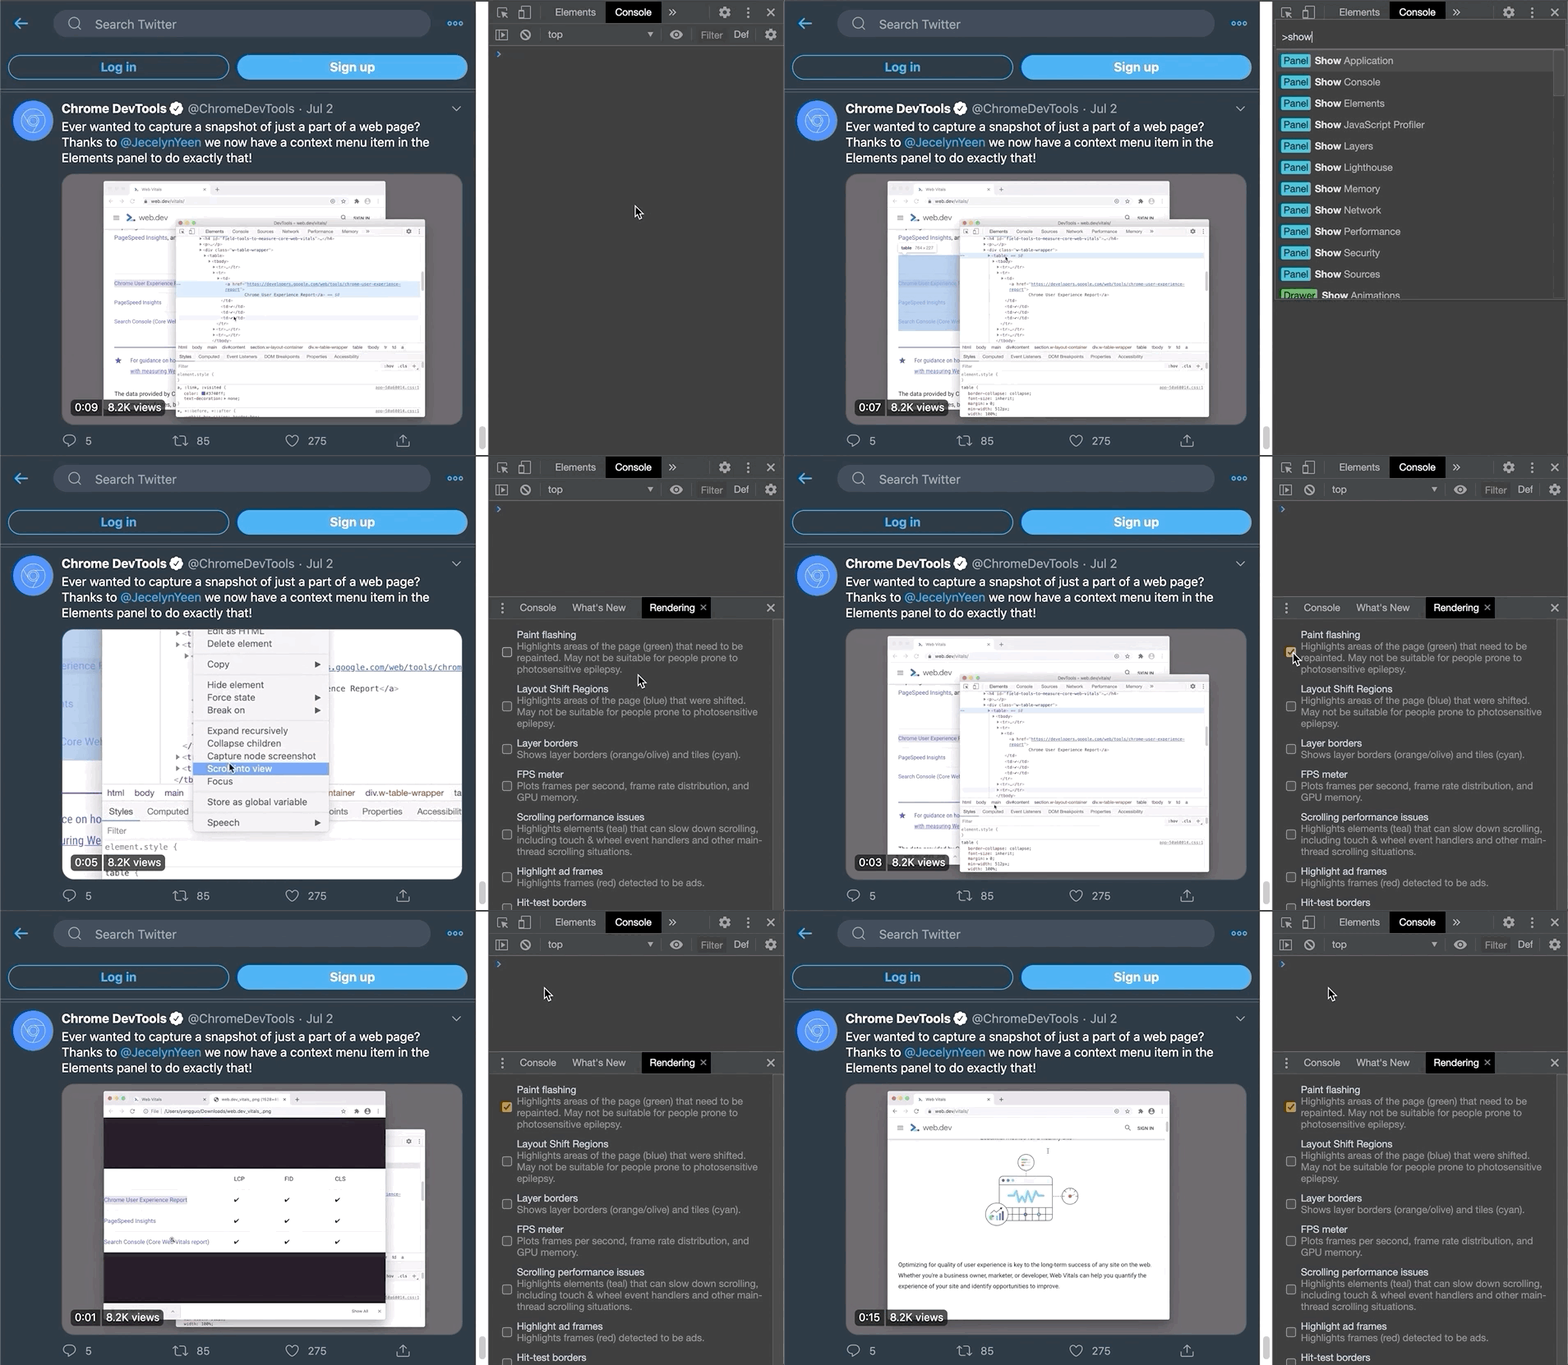
It is helpful to look at what is rendering when we interact with our page, particularly when looking at performance issues. To highlight changes in the DOM we can go to Console, bring the tools bar using Ctrl + Shift + P (or Cmd + Shift + P in Mac) and then search for Show Rendering. Make sure to select the checkbox in the Rendering tab that activates Paint flashing.
Use Console Functions
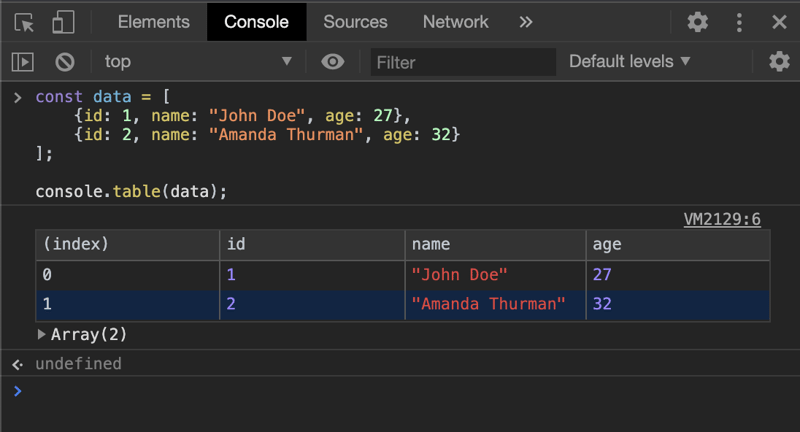
Sometimes we could overuse console.log() to debug when there might be other useful functions for specific purposes inside the Console class.
For example, when logging an array of objects it can be useful to visualize this as a table. Use console.table() to visualize your data this way.
There are also different types of logs that we can use to prioritize issues like warning, error, and info.
You can then use the dropdown “Default levels” next to the filter box to filter between different types of logs.
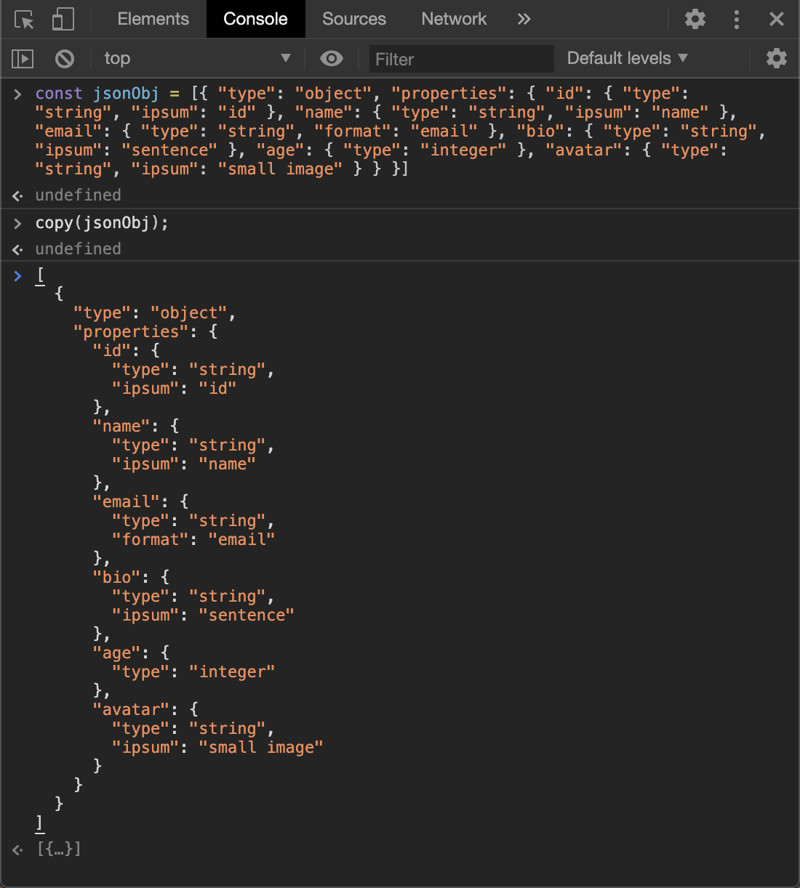
copy(object)
This function allows you to copy anything into the clipboard. It is particularly useful when giving it a JSON object as it will copy a prettified version of your JSON into the clipboard.
You can also give this function an HTML element and it will copy it (and their children, if they do have any!)
DevTools has many other options that can help your productivity, for more information check out Chrome DevTools official documentation or Chrome DevTools Twitter account for new updates and tips.

Posted on July 25, 2020
Join Our Newsletter. No Spam, Only the good stuff.
Sign up to receive the latest update from our blog.
