Why You Should Leverage Database Integration with OpenTelemetry

Adam Furmanek
Posted on May 23, 2024

Database observability is crucial for maintaining optimal performance and reliability in modern software systems. It enables organizations to monitor key metrics such as query execution time, resource utilization, and transaction throughput, facilitating the early detection and resolution of issues like slow queries or resource contention. Good observability gives safety as all the operations are monitored and protected. Specifically for developers, observability lets them understand the performance implications of the application changes even before they reach production.
When it comes to practical aspects, we can use OpenTelemetry (OTel) for building the observability around databases. OpenTelemetry is an open-source observability framework designed to facilitate the instrumentation and collection of various signals like distributed traces or metrics. It’s a set of specifications of how to shape the data and a set of SDKs streamlining the processing of the signals afterward. With support for multiple programming languages and integrations with popular observability tools, OpenTelemetry has become a vital tool for organizations aiming to adopt a standardized and comprehensive approach to monitoring and troubleshooting their complex, microservices-based architectures. Since OTel is open and well-standardized, many OTel collectors emerged that make capturing the data a breeze.
Metis uses OpenTelemetry to deliver the best possible experience. Metis uses OTel to extract details of database activity and application changes and then can correlate them to provide full database observability and understanding of what happened. This way, Metis can pinpoint performance bottlenecks and build a comprehensive story explaining why they happen. For instance, Metis can explain that the recent changes to the application code resulted in different SQL queries being executed, which in turn didn’t use indexing as much and led to lower performance. Such examples of database monitoring prove that observability lowers the cost of maintenance and development. This is just one of many reasons why every database (not only enterprise database) can benefit from database integration with observability tooling.
Recommended reading: How to prevent database problems from hitting production?
Why Integrate Your Database with OpenTelemetry?
There are many benefits of database observability. Let’s see some of them.
First, database observability allows tracking and monitoring of database performance metrics such as query execution time, resource utilization, and transaction throughput. Identifying bottlenecks or inefficient queries helps in optimizing database performance and ensuring responsive applications. We always need to make sure that there are no database performance issues, as they spread throughout the ecosystem and affect our business. Also, by collecting and analyzing telemetry data, database observability helps in the early detection of issues like slow queries, deadlocks, or resource contention. This enables prompt troubleshooting and resolution before these issues impact application performance or user experience.
Next, database observability helps with capacity planning. Observing trends in data growth, query loads, and resource consumption helps organizations scale their databases appropriately, ensuring they can handle increasing workloads without compromising performance. This also leads to cost reduction as it helps in making informed decisions about scaling, resource allocation, and choosing the right database solutions based on performance and cost considerations.
Database observability provides insights into dependencies and relationships between services. Tracing queries across microservices helps in identifying the root cause of issues and understanding the impact of changes on the overall system. This is also essential for monitoring database access patterns and detecting potential security threats. By tracking user activity and permissions, organizations can ensure compliance with security policies and regulations, helping to protect sensitive data from unauthorized access.
Finally, database observability enables proactive maintenance by providing insights into the health and status of the database. Predictive analysis can help in identifying issues before they become critical, allowing for scheduled maintenance and minimizing unplanned downtime.
Recommended reading: How To Master PostgreSQL Performance Like Never Before
To build database observability, we need to select the right tools and libraries. The best candidate is OpenTelemetry (OTel). It’s a set of standards, specifications, libraries, SDKs, and open-source integrations that cover the entire observability ecosystem. With OTel, we can capture signals with little-to-no application changes (for instance by configuring environment variables when running the application), we get a vast number of tools for storing, processing, displaying, and manipulating the signals, and we get integrations with many libraries and frameworks out of the box.
Just like we have logging in our applications, we can OTel to capture metrics, traces, and details of interactions between applications, services, and databases. OpenTelemetry is the modern industry standard for processing the signals, so most of the time we don’t need to build custom tools. We just take components off the shelf.
Key Components of OpenTelemetry for Database Integration
OpenTelemetry provides many components working together to capture and process the signals. Let’s explore them.
At a glance, the process looks like this: the application must know what signals to emit and what they should look like. Next, the application must emit the signals somehow. The signals must then be captured and processed, so they can be visualized for the users. OpenTelemetry covers all these aspects. Let’s see how.
First, OTel defines the shape of the structures. This includes a list of fields, their values, format, and meaning. This way, applications from various technologies can interoperate and provide data uniformly. All data schemas are well documented and used in the same way between tools and programming languages.
Next, the application must emit the signals somehow. OpenTelemetry provides SDKs for many programming languages. All we need to do is to install the SDK and use it. We don’t need to deal with low-level details of protocols or data structures, as the SDK provides high-level APIs for creating traces and spans.
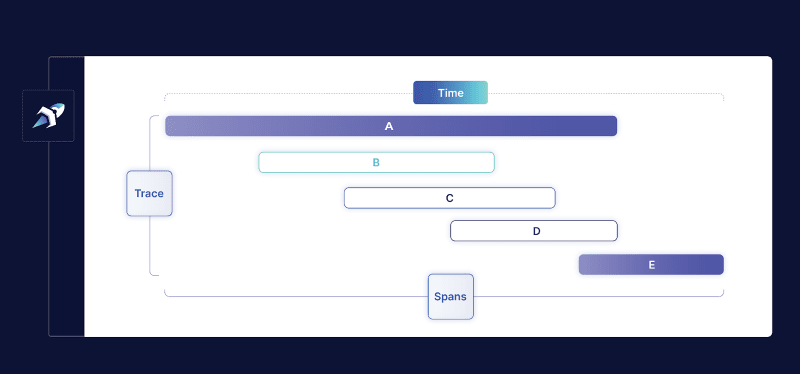
A span encapsulates a single task, for instance, an API call or a database query execution. A trace is a collection of related spans. We can use traces to present the history of what happened and how. Let’s see the image:
This whole picture is a trace. It represents five operations represented by five different spans. Each span (with letters A to E) represents one particular operation, like an API call, file access, or query execution. We can create these traces and spans using the OpenTelemetry SDK with high-level APIs.
If we don’t write the application but rather use existing tools (like databases, queues, and file stores), then many of these tools integrate with OpenTelemetry already. OpenTelemetry lists a few tens of receivers for various tools. You can just take the receiver and capture signals right away. Specifically for databases, there are receivers for many popular databases, including PostgreSQL, MySQL, Oracle, and MS SQL.
Next, once the signals are emitted, they need to be captured and processed. Many collectors can do that. You can use the one provided by OpenTelemetry, or you can use open-source solutions tuned for specific cases (like microservices or SQL databases).
Apart from capturing and visualizing signals, the receivers and the collectors can handle confidential information and personal information that needs to be anonymized. It is safe to run these tools in highly constrained environments where the anonymity and security of the data are crucial.
Practical Guide to Integrating Your Database with OTel
There are three areas that we need to cover to build database integration with OpenTelemetry. These are queries, schemas, and metrics. In this section, we’ll use Postgres integration as an example, but the same steps apply to other databases as well.
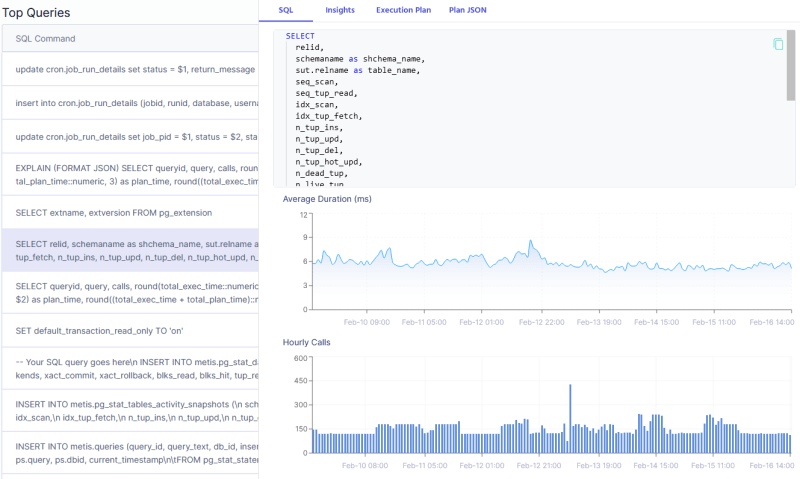
The first area we need to cover is the queries that run in the database. We need to analyze the live database activity, capture the execution plans, and monitor the usage of the indexes or if statistics are up to date. We can do that by reconfiguring the database to use a slow query log, or we can deploy an agent monitoring the database activity.
Metis provides an agent that can do that for you. The agent connects to your database and extracts the running queries, and their plans, and then provides suggestions on how to improve the performance. You just need to deploy the Docker container and let it connect to the database server.
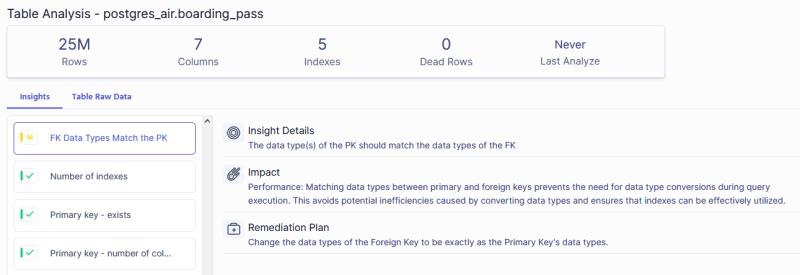
The other area is schemas. There are many aspects that we should pay attention to. Data types, fragmentation, vacuuming, primary keys, secondary keys, normalization, denormalization, and much more. We need to check the tables and analyze them to understand if we store and process the data optimally. Metis can do that and analyze all the database details for you.
The last area is metrics about the database and infrastructure activity. This includes CPU, number of transactions, memory used, buffers, and much more. To do that, we need to use OpenTelemetry to extract the metrics directly from the database engine. Again, Metis can do that for us.
Analyzing Database Performance with OpenTelemetry
Once we capture all the data with OpenTelemetry, we can analyze the signals to reason about the performance.
First, establish a baseline for normal behavior by monitoring your database under typical workloads. Check the metrics when your database is known to perform “well”. This helps in distinguishing normal variations from actual performance anomalies. Tools like Metis, Prometheus, Grafana, or commercial monitoring solutions can assist in visualizing and establishing baselines.
Next, look for metrics that indicate potential bottlenecks. High CPU or disk utilization, long query execution times, or a spike in connection errors can point to performance issues. Utilize monitoring tools to set up alerts for thresholds that, when breached, indicate potential problems. Generally, spikes in metrics should be a good starting point for analysis. However, they always need to be correlated with the typical weekly patterns observed in your business activity (like more load during peak hours).
Recommended reading: Troubleshooting PostgreSQL High CPU Usage
Once you identify times of the week when things are off, focus on analyzing the performance of individual queries. Identify slow or resource-intensive queries by examining metrics such as execution time, query plans, and indexes. Database query profilers and tools like EXPLAIN in SQL databases can provide insights into query performance. Use Metis to perform this analysis automatically
Next, look for issues that can be easily identified automatically. Check metrics related to locks and deadlocks, as these can significantly impact database performance. Identify long-running transactions and investigate if they are causing contention or blocking other transactions.
Always look for patterns and relationships. Correlate data from various areas, like CPU and memory consumption, and the number of transactions.
By systematically analyzing database metrics and adopting a proactive approach, you can identify and address performance issues before they impact the overall performance of your application. Regular monitoring and analysis are key components of maintaining a healthy and efficient database environment.
Finally, configure alarms to get automated notifications when metrics cross the thresholds. Metis can do that for you automatically.
Common Challenges and Solutions in Database Integration with OTel
As with every process, things may go wrong. Let’s now see a couple of typical challenges when building the database integration.
First, instrumenting applications with OpenTelemetry can introduce some level of overhead, impacting the performance of the monitored system. Measure the impact and check if it’s acceptable. Keep in mind that this is affecting your production systems, so you shouldn’t deploy it blindly.
Next, the amount of telemetry data generated by OpenTelemetry can be substantial, especially in large and complex systems. Managing and storing this data efficiently can be a challenge, requiring careful consideration of storage solutions and data retention policies. You need to recycle the log files, compress them, and store them in some centralized place. Same with metrics and other structured data.
Another issue is the legacy systems. Integrating OpenTelemetry with legacy systems that lack native support for observability may require additional effort. Retrofitting instrumentation into older codebases or systems may not be straightforward, potentially limiting the depth of observability in those components. However, the true power of observability comes from the full coverage. You need to integrate all your systems, so plan how you can do that with some older solutions.
Recommended reading: Observability vs Monitoring: Key Differences & How They Pair
Finally, telemetry data must be protected and secured. It contains all the crucial information and you need to make sure to not leak any of that. Limit the access to the data as much as possible. Always encrypt your data and do not expose it publicly.
Conclusion
Database observability is crucial for maintaining the optimal performance of your database. Your organization can greatly benefit from observability. OpenTelemetry can make this much easier thanks to its SDKs and open-source solutions.
On top of that, Metis can automate most of the aspects. Metis can capture schemas, queries, configurations, extensions, and metrics. Metis can also suggest improvements and alert you when things go wrong. If you are yet to build observability, go with OpenTelemetry and Metis.
FAQs
What is database integration and why is it important for enterprises?
Observability integration is important as it gives the constant monitoring of your databases. It can alert you when things go wrong, prevent issues from happening, and clearly show the status of the system.
How does database integration with OpenTelemetry improve performance monitoring?
OpenTelemetry makes the monitoring much easier thanks to SDKs and many open-source tools. Organizations don’t need to build their solutions but can utilize OpenTelemetry instead.
Can OpenTelemetry be used for both SQL and NoSQL databases?
Yes. OpenTelemetry integrates with many systems, including SQL and NoSQL databases.
What are the security considerations when integrating your database with OpenTelemetry?
Telemetry data contains crucial details of your business, including personally identifiable information. You need to limit access to the data, encrypt it, and not expose it publicly.

Posted on May 23, 2024
Join Our Newsletter. No Spam, Only the good stuff.
Sign up to receive the latest update from our blog.


