DevLake as a DevOps Data Monitoring Tool

Shubham Gupta
Posted on February 19, 2023
No matter what business or career you've chosen, data visualization can help by delivering data in the most efficient way possible. As one of the essential steps in the business intelligence process, data visualization takes the raw data, models it, and delivers the data so that conclusions can be reached.
Understanding the Importance of DevOps Data Visualization
In today's automated environments, there are panels that reserves the information about how an individual component/process is behaving at any particular instant compared to the past when we used to have instant meters which gave us instant readings. These automated systems help us to collect the raw data from their databases using plugins and display that data in real-time. Data visualization tools like grafana make the quick understanding to the user and give insight into any particular state of what is happening inside the system/component.
DevOps is a set of practices that collaborate communication of software development and IT operations team. It aims to shorten the systems development life cycle and provide continuous delivery with high software quality. While automating the process of Software delivery there could be certain tools that can be examined to provide situational insights.
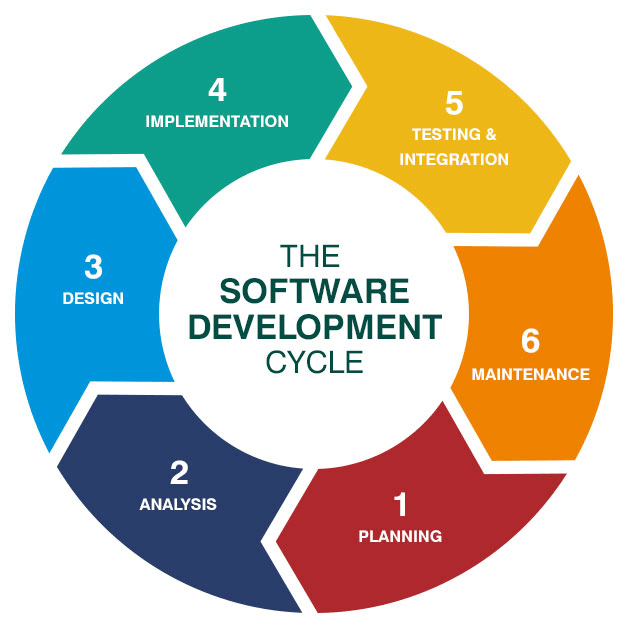
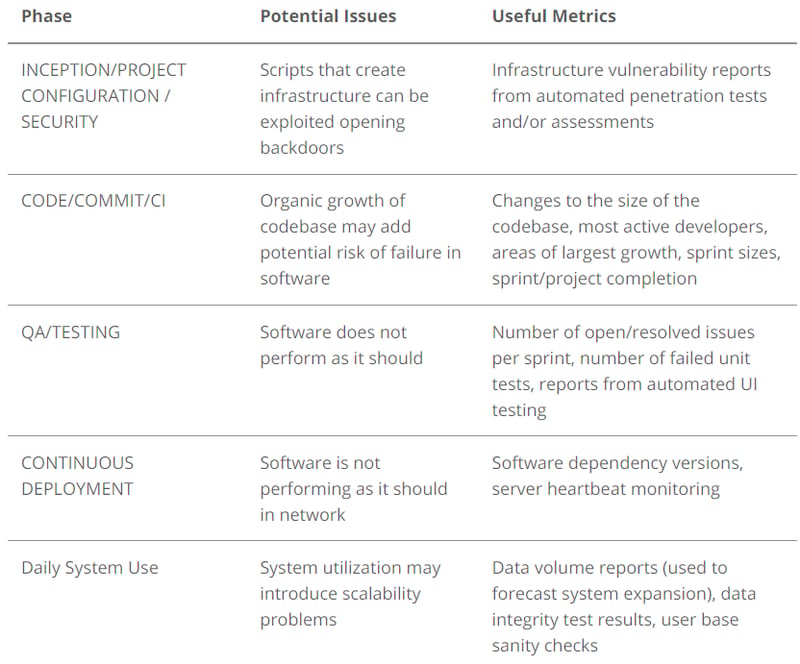
At every stage of the diagram, we can take advantage of the analytical opportunities of that phase to gather meaningful metrics. Here is a list of the different phases and the corresponding metrics that could be monitored throughout the lifecycle:
How DevLake provides the Monitoring Solution?
Devlake is an open-source dev data platform that ingests, analyzes, and visualizes the fragmented data from DevOps tools to distil insights for engineering productivity. DevLake is designed for developer teams looking to make better sense of their development process and to bring a more data-driven approach to their own practices.
In simpler language devlake is a tool that helps us to collect our DevOps data, through various plugins that devlake stores in its repository. The data is further analyzed and we produce amazing graphical insights that would help to boost productivity. Let's take a simple example: Merico-dev is an organization that wants to keep track of all the commits/issues/PRs happening over the repository, maintaining and analyzing data would be a tedious process, but where devlake comes in, it would collect the data from GitHub, store the data in MySQL and visualize on grafana dashboard. In this way, Merico-dev can compare this month's productivity to the last month and could reward the developer with the most commits/issues/PRs merged.
A typical DevLake plugin's dataflow is illustrated below:
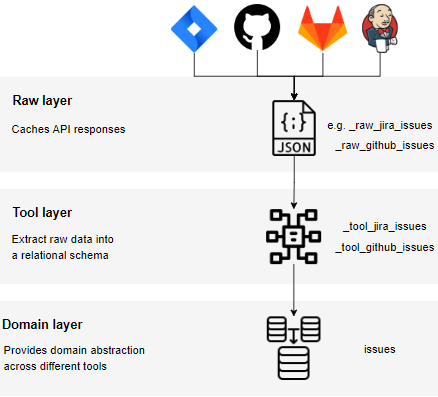
- The Raw layer stores the API responses from data sources (DevOps tools) in JSON.
- The Tool layer extracts raw data from JSONs into a relational schema that's easier to consume for analytical tasks.
- The Domain layer attempts to build a layer of abstraction on top of the Tool layer so that analytics logic can be re-used across different tools.
So, when a pipeline is successfully run you get the complete collection of data you check out the scope of data from here. Successful pipelines can be analyzed on Dashboard like Grafana by using MySQL queries.
How to analyze DORA Metrics using DevLake
DevOps Research and Assessment (DORA) team has identified four key metrics that indicate the performance of a software development team the main idea is to figure out whether they are "low performers" to "elite performers". The four key metrics used are Deployment frequency (DF), Lead time for changes (LT), Mean time to recovery (MTTR), and Change failure rate (CFR).
- Deployment Frequency - The frequency of the software release of an organization to the production level.
- Lead Time for Changes - The amount of time an organization takes a commit/PR to get into the production level.
- Change Failure Rate - The percentage of deployments causing a failure in production.
- Time to Restore Service - How long it takes an organization to recover from a failure in production.
One of the biggest challenges of gathering these DORA metrics is solved by DevLake, currently, DevLake has 25+ plugins which help to collect the DevOps data from every stage of the SDLC and store it in a containerized database. The complete process can be automated by using CronJob ( i.e. DevLake BluePrint feature ).
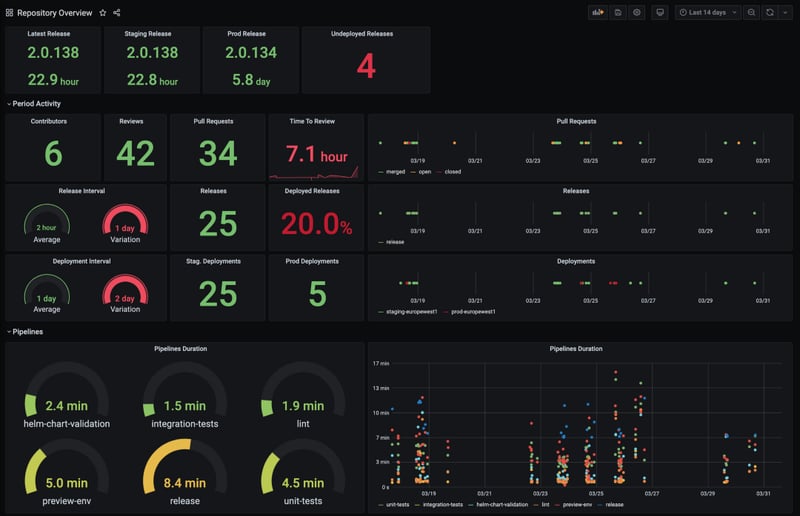
Resulted Dashboard of DevLake
Calculating the Metrics
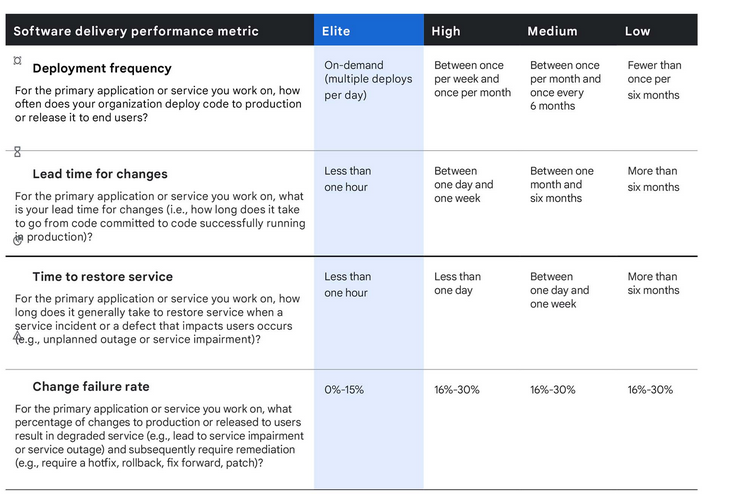
In this section, we would discuss how to translate the resulted data into the system-level calculation. This original research done by the DORA team surveyed real people rather than gathering systems data and bucketed metrics into a performance level, as follows:
Conclusion :
DevLake aims to become an ideal tool when it comes to analyzing any metrics of DevOps, through its extended plugins and robust data collecting system. It provides flexibility over the standard query and the user can create its dashboard.
References :
- https://analytiks.co/importance-of-data-visualization/#:~:text=Data%20visualization%20gives%20us%20a,outliers%20within%20large%20data%20sets.
- https://en.wikipedia.org/wiki/DevOps
- https://insights.sei.cmu.edu/blog/information-visualization-as-a-devops-monitoring-tool/
- https://devlake.apache.org/docs/DataModels/DevLakeDomainLayerSchema
- https://cloud.google.com/blog/products/devops-sre/using-the-four-keys-to-measure-your-devops-performance

Posted on February 19, 2023
Join Our Newsletter. No Spam, Only the good stuff.
Sign up to receive the latest update from our blog.
