OpenTelemetry Journey #01 - Important concepts

Luiz Lelis
Posted on March 24, 2024

First of all, let's start with the basics. There are some important concepts to be clarified before we dive into the OpenTelemetry world. The vast majority of the naming conventions and concepts are from projects and papers that inspired OpenTelemetry, such as OpenTracing, OpenCensus and Dapper.
What is Observability?
In control theory, observability is a measure of how well the internal states of a system can be inferred from knowledge of its external outputs. Making a relationship with software systems, observability is the ability to understand the internal state of a system by examining telemetry data. This telemetry data is what we call signals.
In order to understand the internal state of a system, the application must be properly instrumented to emit signals enough to provide a clear picture of what is happening.
Context propagation
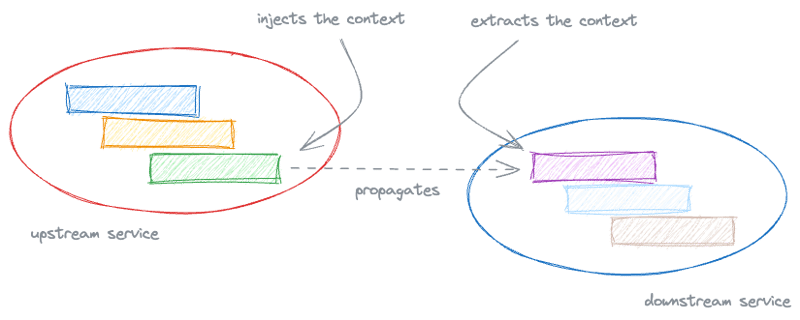
Context propagation is the mechanism that allows the correlation of signals emitted by different parts of a system. It is essential to understand the flow of a request through a distributed system.
Basically, to propagate a context, the upstream service must inject the context into the request, and the downstream service must extract the context from the request. That propagation is handled by the instrumentation libraries, but can be manually implemented as well through the Propagation APIs.
Spans
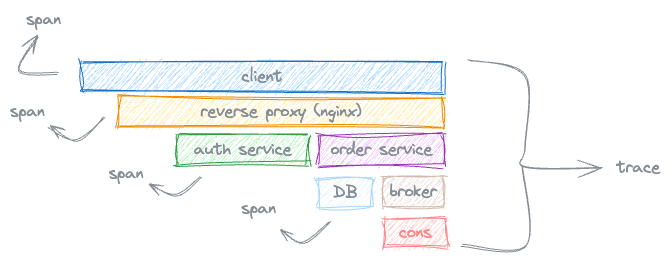
A span represents a single operation, also known as a unit of work, from a distributed transaction. It is composed of a name, a start time and other time-related data, structured log data and metadata (also known as span attributes) that can provide additional information to the tracked operation.
What are Signals?
Signals are outputs from a system that can be used to understand its internal state. Currently, OpenTelemetry supports traces, metrics, logs and baggage (there is an ongoing effort to support profiling as well).
Traces
Traces are a way to follow the path of a request through a distributed system. They are composed of spans, which represent the operations that are part of the request.
Metrics
Metrics represent a measurement captured at runtime. They are the most important indicators of availability, performance and resource usage of a system. Some important examples of metrics are: throughput, response time, error rate, CPU utilization, Memory utilization, etc.
Logs
Maybe this is the most familiar signal for developers. Logs are text records with a timestamp that can be used to understand the behavior of a system. They are useful to understand the context of a specific operation.
OpenTelemetry uses a different approach to handle this signal. As there are already many logging libraries available, OpenTelemetry acts as a bridge between those logs solutions and the OpenTelemetry ecosystem.
Baggage
Baggage is a way to propagate contextual information through the system. It is a key-value pair store that is attached to a span context and must be propagated through the system. The OpenTelemetry official documentation has a great example about it:
imagine you want to have a
CustomerIdattribute on every span in your trace, which involves multiple services; however,CustomerIdis only available in one specific service. To accomplish your goal, you can use OpenTelemetry Baggage to propagate this value across your system.
Instrumentation
Instrumentation is the process of making your system observable, or making your applications available to emit signals. OpenTelemetry provides two ways to instrument your application: Code-based and Zero-code.
Code-based instrumentation
Code-based instrumentation is the process of adding code to your application to emit signals. In this approach, you must import the OpenTelemetry libraries to your service code. This approach is more flexible because you can customize the instrumentation as you want or use third-party libraries that are only available for code-based instrumentation, besides, your application’s code is not typically instrumented and to instrument it you’ll need to use code-based instrumentation. On the other hand, you are adding some infrastructure responsibilities to your business code.
Zero-code instrumentation
Zero-code approach, also known as automatic instrumentation, allows you to add observability to your application without the need to write code. This approach is more straightforward and less error-prone, but it is less flexible than code-based instrumentation. In this approach, the OpenTelemetry capabilities are added to your application as an agent or agent-like installation.
Maybe you are asking yourself: "How does the zero-code instrumentation work?". The zero-code instrumentation mechanisms may differ by language, ranging from bytecode manipulation, monkey patching, or eBPF to inject calls to the OpenTelemetry API and SDK into your application. Currently, the automatic instrumentation is available for the following languages:
Conclusion
In this article, we covered some important concepts that are essential to understand before diving into the OpenTelemetry world. We talked about observability, context propagation, spans, signals, and instrumentation. In the next articles, we will dive deeper into the OpenTelemetry ecosystem, exploring the OpenTelemetry Collector and the observability data pipeline. If you have any questions or suggestions, please let me know in the comments below.

Posted on March 24, 2024
Join Our Newsletter. No Spam, Only the good stuff.
Sign up to receive the latest update from our blog.


