Kubernetes Cost Monitoring With Kubecost

Lukas Gentele
Posted on June 16, 2022

By Aniket Bhattacharyea
Kubernetes has taken the software development world by storm. It gives you an excellent framework to deploy your application with and abstracts away the low-level details of the underlying infrastructure. But just like everything great, it comes with a tradeoff.
Since it makes deployments easy and smooth, it's possible to overprovision resources that can end up driving cloud costs up. In my previous company, we used Amazon EKS to host our infrastructure. Our cost used to be around $1000 per month—much higher than we had anticipated based on our actual production utilization. The culprit turned out to be unutilized clusters. We created some clusters for testing and experimentation, and unlike the production workload that ran all the time, these clusters were used sparingly. Since these were not deleted, they kept accumulating costs even though they were unused most of the time.
Due to the containerized nature of Kubernetes, the traditional methods of estimating cost and allocating resources don't work. You need detailed insight into how your resources are being utilized throughout the various components of Kubernetes in order to make decisions.
Kubecost is a tool that helps you with cost-optimization and estimation for Kubernetes. It gives you real-time visibility into your resource utilization and provides you with a detailed breakdown of your costs. Kubecost also lets you assign out-of-cluster costs (eg, database or storage costs) to get complete insight across the entire spectrum of your cloud costs. With the help of Kubecost, you can also set up notifications to quickly catch cost spikes and take action accordingly.
In this article, you will learn how to install Kubecost in a Kubernetes cluster. You'll also get introduced to the sleep mode by Loft Labs, which can help you take action against high costs incurred by unused resources.
Installing Kubecost
In order to install Kubecost, you need the following prerequisites:
- A Kubernetes cluster. You can use any cloud-based cluster like EKS or GKE, or you can use a local cluster with Minikube.
- Kubectl installed and configured for your cluster.
- Helm 3.0+ installed and configured.
Use the following command to create a kubecost namespace and install Prometheus, Grafana, and kube-state-metrics in the namespace. You can further customize the installation with additional configuration as described here.
kubectl create namespace kubecost
helm repo add kubecost https://kubecost.github.io/cost-analyzer/
helm install kubecost kubecost/cost-analyzer --namespace kubecost --set kubecostToken="YW5pa2V0QGFiaGF0dGFjaGFyeWVhLmRldg==xm343yadf98"
Next, run kubectl get pods -n kubecost and ensure all the pods are in the Running state.
Once all the pods are running, run the following command to enable port-forwarding:
kubectl port-forward --namespace kubecost deployment/kubecost-cost-analyzer 9090
Note that if you’re running Kubecost on Minikube, you need to perform some additional steps:
- Run
kubectl edit cm nginx-conf -n kubecost, which will open the NGINX ConfigMap in your editor. - Search for kubecost-cost-analyzer.kubecost:9001 and kubecost-cost-analyzer.kubecost:9003 and change them to localhost:9001 and localhost:9003 respectively. Save the file and close the editor.
- Restart the
kubecost-cost-analyzerpod. There are many ways to do it, but the most straightforward is running the commandkubectl rollout restart deployment kubecost-cost-analyzer -n kubecost.
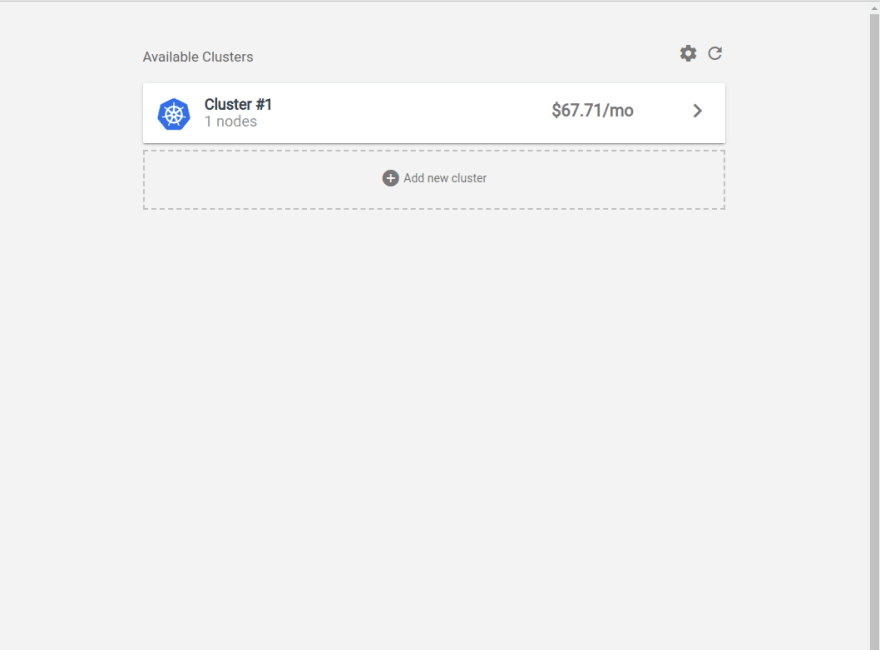
Now you can visit localhost:9090 in your browser, and you should see the following Kubecost screen.
In case it shows No available clusters or throws some other error during installation, you can consult the troubleshooting guide.
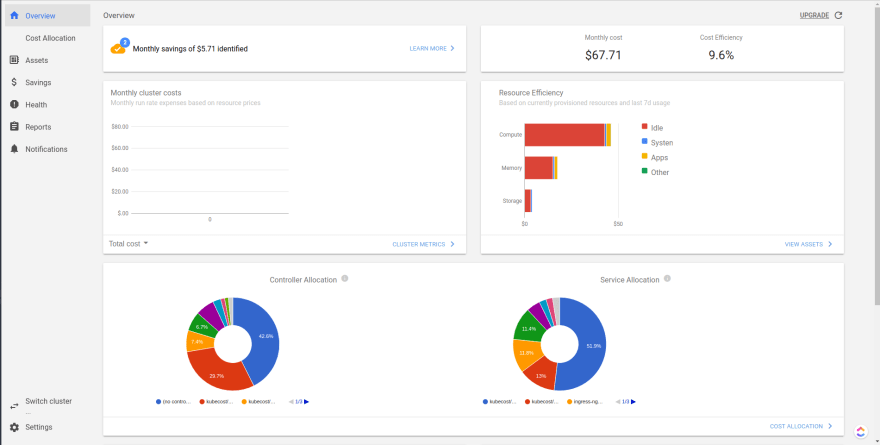
You can click on the available cluster, which should take you to the dashboard where you can see various information about your cluster at a glance.
Using Kubecost
Once Kubecost has been installed, you can start by looking at the cost allocations. The Cost Allocation page shows you a breakdown of your expenses. By default, the breakdown is grouped by namespaces. For each namespace, you see the cost incurred across various aspects like CPU, GPU, Memory, and PV.
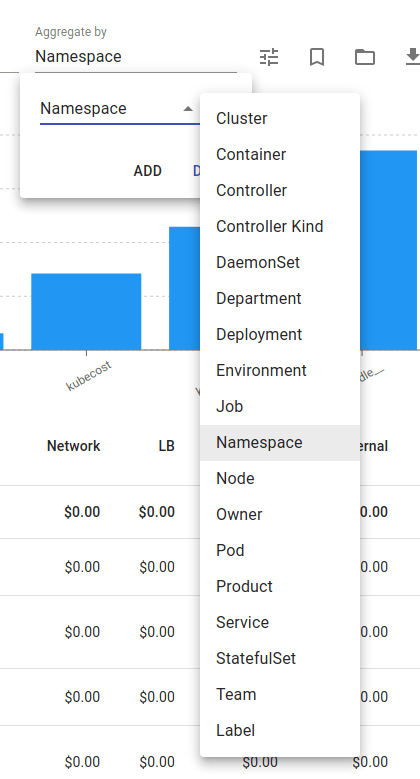
You can use the Aggregate By dropdown to see the breakdown by various Kubernetes concepts like clusters, containers, deployments,and pods. The breakdown is available by other non-Kubernetes organizational concepts like Team, Department, and Product. These aggregations are based on Kubernetes labels referenced at the pod or namespace level.
Using the Date Range dropdown, you can change the date range of the report. You can use some common ranges like Last 7 days, Today, Yesterday, and Last 30 days, or you can enter a custom start and end date.
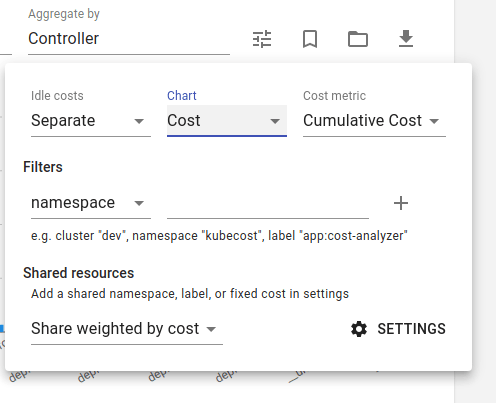
Click on the options menu to modify some additional options. You can change the chart type to show cost over time or proportional cost. The cost metric can be changed to daily, hourly, or monthly rate, as well as cumulative cost over the date range.
You can also apply filters to fine-tune the report. Documentation for these options can be found here.
Finally, you can use the Save, Load, and Download buttons to save the report settings, load saved reports, or download the report in CSV format.
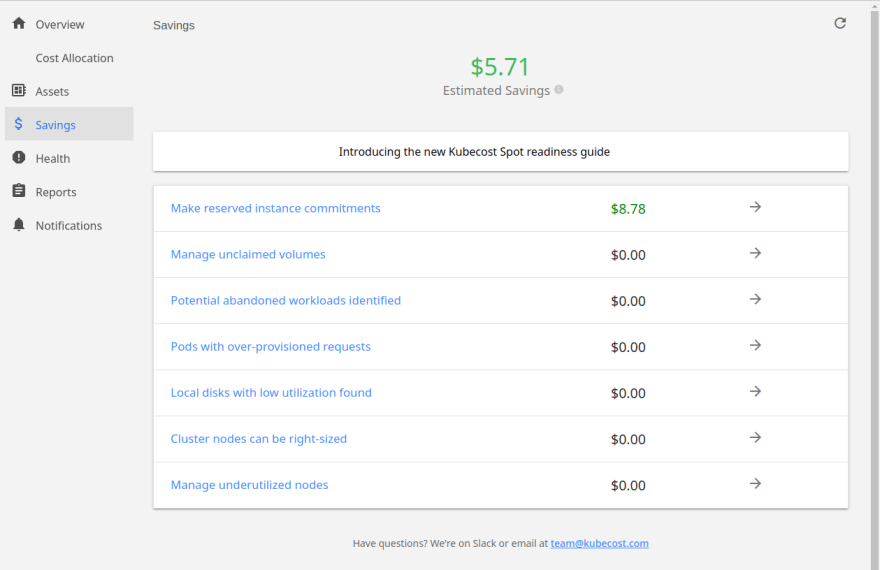
The Savings page lists some recommended actions that can be taken to save some cost. These actions include making reserved instance commitments, managing unclaimed volumes, managing pods with over-provisioned requests, and managing local disks with low utilization. Click on each recommendation to learn more about them.
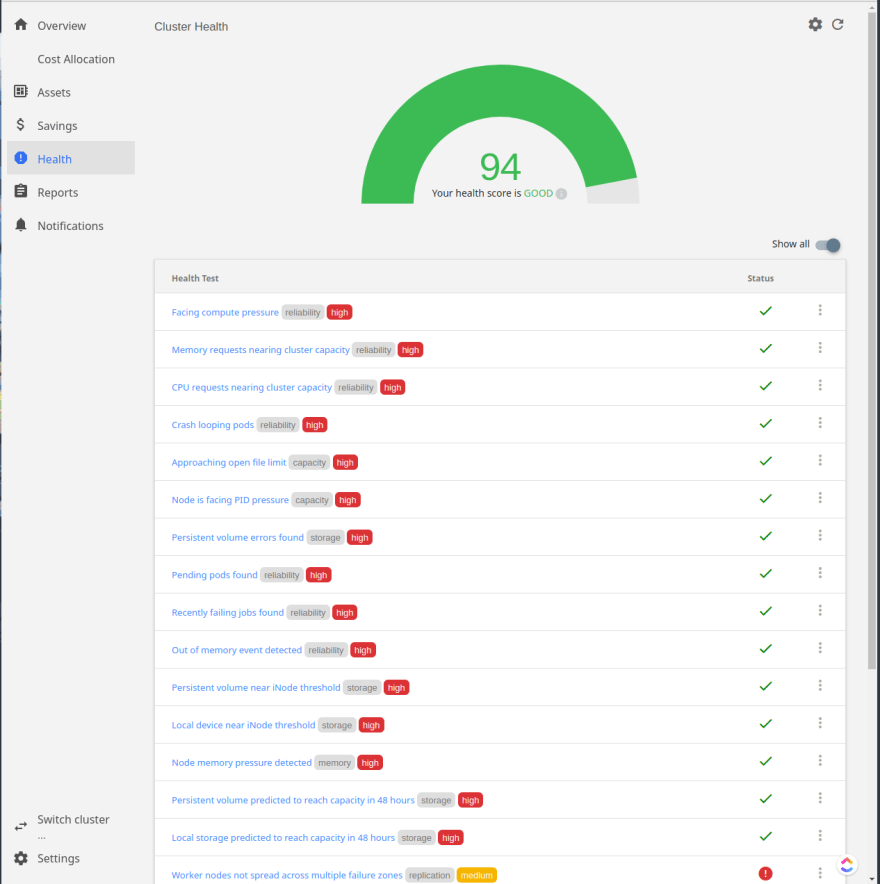
On the Health page, you can see the health score of your cluster, which is an assessment of infrastructure reliability and performance. Kubecost performs a few health tests like monitoring for high CPU and memory utilization, checking for crash looping pods, looking for failing jobs, network issues, and CPU throttling. These health checks ensure your cluster is running smoothly.
Set up Slack or email alerts by visiting the Notifications page. You can set a daily threshold at the cluster level or for individual namespaces and get alerts when the cost exceeds the threshold. Optionally, set it up to send you weekly updates and cluster health updates.
Using Loft's Sleep Mode to Save Cost
While Kubecost is an excellent tool for gaining insight into how resources are being utilized in your Kubernetes cluster, there’s still a manual aspect to it. Kubecost only provides insights; the cluster admins must take manual action based on the reports. This is where Loft's sleep mode comes in.
As mentioned before, one of the biggest reasons for a high cost is idle resources. Loft's sleep mode takes care of this by putting spaces or virtual clusters to sleep after a specified period of inactivity. They automatically wake up when a kubectl, Helm, or any other command involving the space or virtual cluster is executed.
Loft does this by storing the replica number for Deployments, StatefulSets, DaemonSets, and other ReplicaSet-based resources and scales down the replica number to 0, causing Kubernetes to delete all pods and containers. When the first activity is performed in the space or virtual cluster, Loft restores this replica number, essentially restarting the space/virtual cluster.
This "first activity" that wakes up the space can be any interaction with the space, either via kubectl, Helm, or any other tool. It's also possible to manually wake up spaces.
Loft's sleep mode grants you the ability to enforce automatic sleep for all spaces or individual spaces after a specified period of inactivity. It's also possible to manually trigger sleep mode for individual spaces. You can even exclude resources from being put into sleep for more fine-grained control.
Conclusion
While Kubernetes is an excellent tool for managing containers, it can cost a fortune if extra thought is not given to resource management. With Kubecost at your disposal, you can gain a real-time overview of your resource usage and catch cost overruns early. And using Loft's sleep mode, you can automatically shut down unused resources to save money. With the combination of Kubecost and Loft's sleep mode, you can have a highly performant cluster with minimal cost.
If you’re interested in creating a Kubernetes-based architecture that’s easy to use for your developers, DevOps, IT operations, and sales teams, take a look at Loft. Loft provides a platform for Kubernetes self-service and multi-tenancy that’s highly flexible and performant.
Photo by Pepi Stojanovski on Unsplash

Posted on June 16, 2022
Join Our Newsletter. No Spam, Only the good stuff.
Sign up to receive the latest update from our blog.

