Optimize Node.js performance with clustering

Karan Pratap Singh
Posted on October 1, 2021

In this article, We will see how we can optimize our Node.js applications with clustering. Later we'll also do some benchmarks!
What is clustering?
Node.js is single threaded by default and hence only utilizes one cpu core for that thread. So, to take advantage of all the cores available we need to launch a cluster of Node.js processes.
For this we can use the native cluster module which creates several child processes (workers) that operate parallelly. Each generated process has it's own event loop, V8 instance and memory. The primary process and worker process communicate with each other via IPC (Inter-Process Communication).
Note: Code from this tutorial will be available in this repository
Project Setup
Let's initialize and setup our project!
$ yarn init -y
$ yarn add express typescript ts-node
$ yarn add -D @types/node @types/express
$ yarn tsc --init
Project directory should look like this
├── src
│   ├── cluster.ts
│   ├── default.ts
│   └── server.ts
├── tsconfig.json
├── package.json
└── yarn.lock
server.ts
Here, we'll bootstrap our simple express server
import express, { Request, Response } from 'express';

export function start(): void {
  const app = express();

  app.get('/api/intense', (req: Request, res: Response): void => {
    console.time('intense');
    intenseWork();
    console.timeEnd('intense');
    res.send('Done!');
  });

  app.listen(4000, () => {
    console.log(`Server started with worker ${process.pid}`);
  });
}

/**
 * Mimics some intense server-side work
 */
function intenseWork(): void {
  const list = new Array<number>(1e7);

  for (let i = 0; i < list.length; i++) {
    list[i] = i * 12;
  }
}
default.ts
import * as Server from './server';

Server.start();
Start! Start! Start!
$ yarn ts-node src/default.ts

Server started with worker 22030
cluster.ts
Now let's use the cluster module
import cluster, { Worker } from 'cluster';
import os from 'os';
import * as Server from './server';

if (cluster.isMaster) {
  const cores = os.cpus().length;

  console.log(`Total cores: ${cores}`);
  console.log(`Primary process ${process.pid} is running`);

  for (let i = 0; i < cores; i++) {
    cluster.fork();
  }

  cluster.on('exit', (worker: Worker, code) => {
    console.log(`Worker ${worker.process.pid} exited with code ${code}`);
    console.log('Fork new worker!');
    cluster.fork();
  });
} else {
  Server.start();
}
Start! Start! Start!
$ yarn ts-node src/cluster.ts

Total cores: 12
Primary process 22140 is running
Server started with worker 22146
Server started with worker 22150
Server started with worker 22143
Server started with worker 22147
Server started with worker 22153
Server started with worker 22148
Server started with worker 22144
Server started with worker 22145
Server started with worker 22149
Server started with worker 22154
Server started with worker 22152
Server started with worker 22151
Benchmarking
For benchmarking, I will use apache bench. We can also use loadtest which has similar functionality.
$ ab -n 1000 -c 100 http://localhost:4000/api/intense

Here:

-n requests
-c concurrency
Without Clustering
.
.
.
Connection Times (ms)
              min  mean[+/-sd] median   max
Connect:        0    2   1.0      1       5
Processing:    75 5373 810.7   5598    7190
Waiting:       60 3152 1013.7   3235    5587
Total:         76 5374 810.9   5600    7190

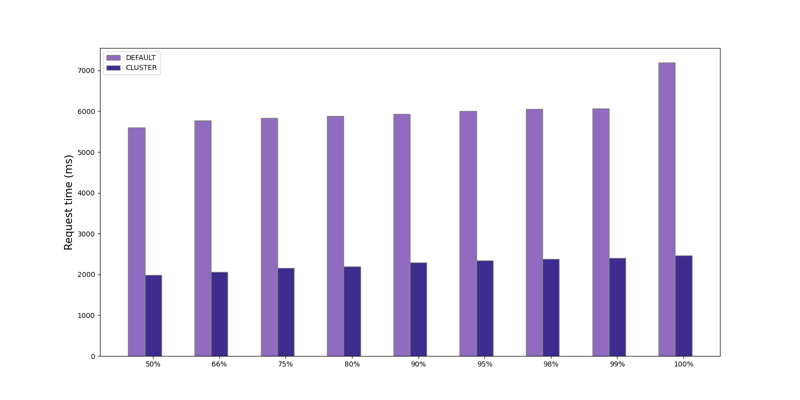
Percentage of the requests served within a certain time (ms)
  50%   5600
  66%   5768
  75%   5829
  80%   5880
  90%   5929
  95%   6006
  98%   6057
  99%   6063
 100%   7190 (longest request)
With Clustering
.
.
.
Connection Times (ms)
              min  mean[+/-sd] median   max
Connect:        0    1   3.8      0      29
Processing:    67 1971 260.4   1988    2460
Waiting:       61 1698 338.3   1744    2201
Total:         67 1972 260.2   1988    2460

Percentage of the requests served within a certain time (ms)
  50%   1988
  66%   2059
  75%   2153
  80%   2199
  90%   2294
  95%   2335
  98%   2379
  99%   2402
 100%   2460 (longest request)
Conclusion
We can see a great reduction in our request time as incoming load is divided between all the worker processes.
If you don't want to use native cluster module, you can also try PM2 which is a process manager with built in load balancer.

Posted on October 1, 2021
Join Our Newsletter. No Spam, Only the good stuff.
Sign up to receive the latest update from our blog.
Related

November 1, 2024
September 20, 2024

