How to Automatically Extract Eligible Rows in Excel

Judith-Excel-Sharing
Posted on March 20, 2024

When processing Excel data, there is an important requirement to filter and extract data that meets one’s own requirements. Of course, we can use Excel’s filtering function to filter and copy the data that meets the conditions. However, the Excel filtering function only filters out static values. When there are new or modified filtering criteria or source data, we need to constantly repeat the filtering and copying operation. Especially when the source data changes and cannot be automatically updated, it is easy to encounter the problem of referencing incorrect data. To solve this problem, Excel also has VLOOKUP available, but VLOOLUP is too complex to write, and the readability of formulas is also poor. When extracting multiple columns, it is necessary to repeatedly write multiple formulas, and extracting multiple rows is simply impossible.
Here we introduce a very useful Excel plugin SPL, which can handle various complex Excel operations. Using it to filter and extract data is easy to operate, the extracted data can be automatically updated, and the formula writing is in line with natural logic, completed in one go. Using SPL to assist Excel calculations doubles work efficiency in seconds.
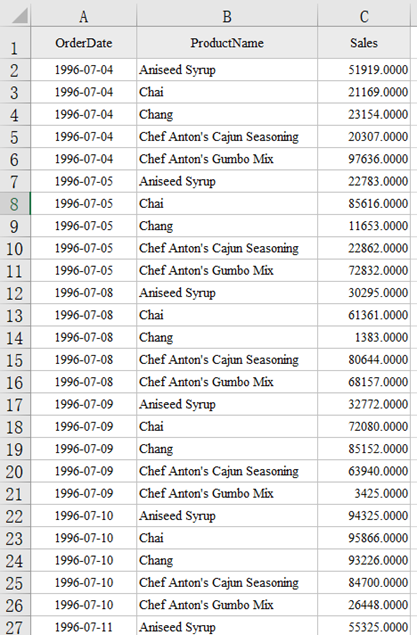
For example, the daily sales data of several products are as follows:
We use this data as the basis to implement several different methods of data filtering, copying and extraction.
Example 1: Extraction after simple conditional data filtering
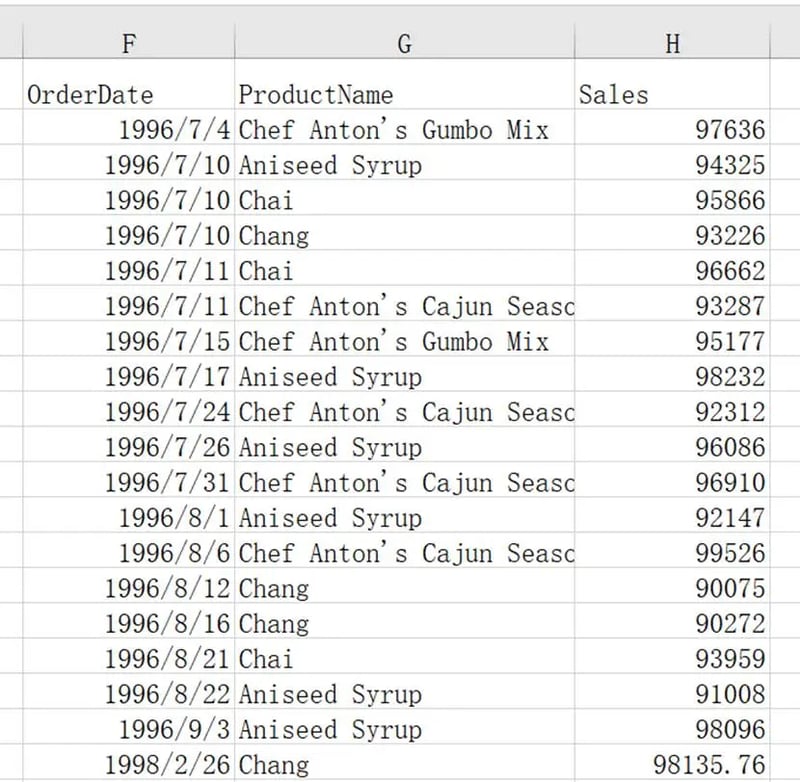
In the above data, identify data with daily sales exceeding 90000 yuan.
The operation method is very simple. Enter the code in the blank cell F1 in Excel:
=spl("=E(?).select(Sales>90000)",A1:C2401)
As shown in the figure
Then press the ctrl-Enter key to return the search results:
Explanation of the code:
spl() represents calling the SPL plugin function
? represents the parameter of the function, as in this code, the parameter value is A1:C2401
E() represents the table that needs to be operated on, and select() selects data that meets the criteria
Therefore, this code indicates that in table A1:C2401, filter out data with sales amount greater than 90000.
When the source data is modified, simply press ctrl-Enter to execute the code of cell F1, the result is automatically updated and there is no need for a new operation.
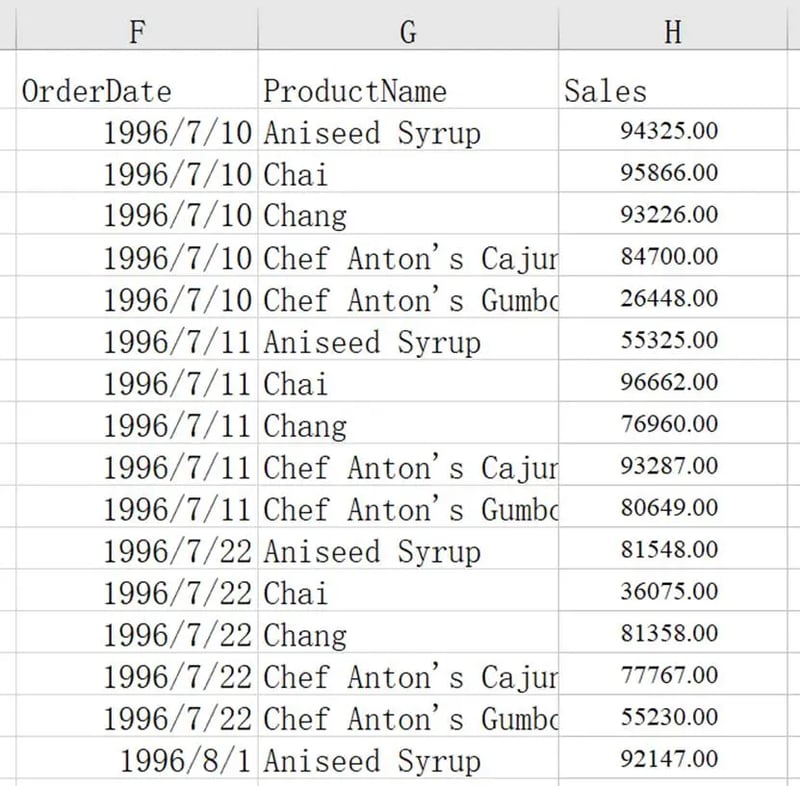
For example, the sales value of the first data item in the source data is 51919, which is a data less than 90000, so it is not in the filtering result. We change it to 90001, and then press ctrl-Enter to execute, as shown in the figure below, this data appears in the filtering result.
Before data modification:
After data modification:
Example 2: Extraction after complex conditional data filtering
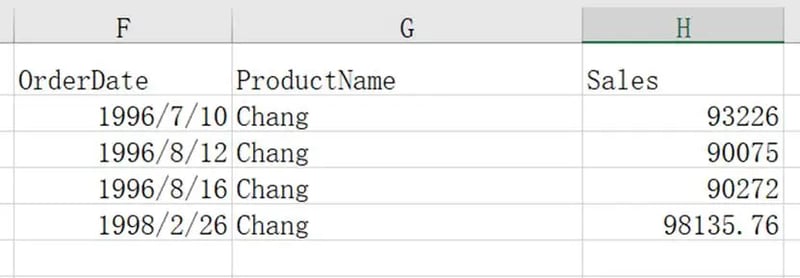
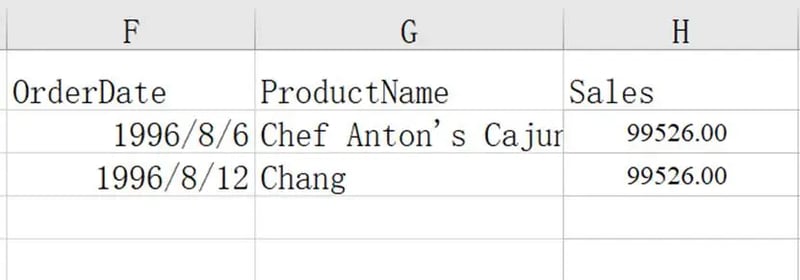
Identify data with product name ‘Chang’ and daily sales exceeding 90000 yuan.
Simply add conditions in the select() function:
=spl("=E(?).select(ProductName==""Chang""&& Sales>90000)",A1:C2401)
Return result:
If the conditions for the next data extraction change, simply modify the conditions in select(), and there is no need for a repeated operation.
Example 3: Extracting after filtering with categorical summary values
Identify daily sales data with a daily total sales amount exceeding 300000 yuan and extract it.
Unlike Example 1 and Example 2, the daily total sales amount does not exist in the original data and needs to be calculated before filtering.
The total daily sales amount is the sum of the daily sales of various products, which can be grouped by date. Group data by date, calculate the sum of each group, and filter based on the sum value.
=spl("=E(?1).group(OrderDate).select(~.sum(Sales)>300000).conj()",A1:C2401)
Return result:
group() is a grouping function, representing grouping by date here. Then calculate the daily total sales for each group and select the group with a value greater than 300000.
Example 4: Extract after searching for the maximum value
Find the data with the highest daily sales amount.
=spl("=E(?).maxp@a(Sales)", A1:C2401)
Return:
maxp@a() represents returning all maximum values.
Example 5: Extract after searching for the top N data
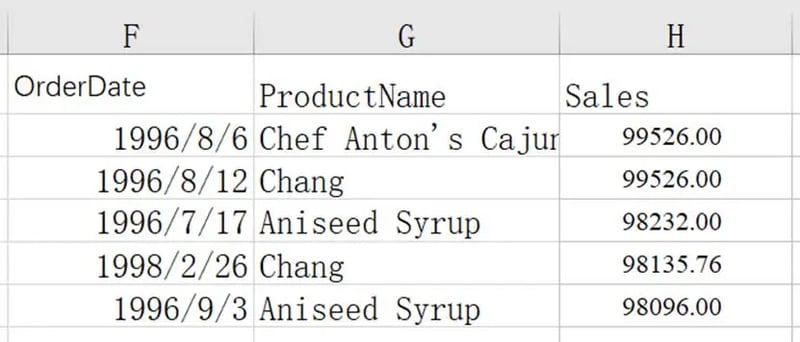
Find the dates with daily sales amount ranking top5.
=spl("=E(?).sort(Sales:-1).to(5)", A1:C2401)
Return result:
sort() is a sorting function, where -1 represents descending order, and to(5) represents getting the top 5 pieces of data.
Using the SPL plugin to filter and extract data is simple, convenient, and efficient, and there are also rich Excel operation cases that can be referenced: Desktop and Excel Data Processing Cases, to help you easily solve various Excel problems in the workplace.
SPL download address: esProc Desktop Download
Plugin Installation Method: SPL XLL Installation and Configuration

Posted on March 20, 2024
Join Our Newsletter. No Spam, Only the good stuff.
Sign up to receive the latest update from our blog.
