Jon Neverland
Posted on January 4, 2019
I recently moved my various services from a bare metal server at Hetzner to their new cloud and a couple of different VPSes, which saves me quite a few dollars (kronor actually but...) a month. Most of my services run in Docker and I've got telegraf running on all servers to monitor my stuff. Mostly because I enjoy looking at all them dashboards in grafana :)
After my migration one of the servers started reporting very high memory usage and it turned out to be the InfluxDB container growing more or less indefinitely. I didn't have that problem before, not that I was aware of atleast, but then again I had 32GB of memory on the old server and wasn't really paying as much attention to the resource consumption of each service.
Anywho, after some research I found this article explaining the problem. The takeaway is that Influx creates an in-memory index with all tags and that quickly grows with a lot of data.
So how to fix? In my case I only have two services I've written myself sending data to Influx and neither were using tags excessively so I started examining the telegraf plugins I had enabled. I'm not 100% certain but I'm pretty sure the culprit was the docker plugin. That plugin paired with my dokku host which creates new containers in abundance with each deploy of a service made up for quite a lot of data. Fortunally the plugin has a setting container_name_include = [] that accepts globs, so limiting the amount of containers reported made a big difference. Especially since the docker telegraf data has a lot of tags in it.
I also set a new retention policy on my database like so:
CREATE RETENTION POLICY one_month ON telegraf DURATION 4w REPLICATION 1 DEFAULT;
and deleted a lot of old data, for example from the docker plugin with a simple DROP SERIES docker (etc, there are about 4 series).
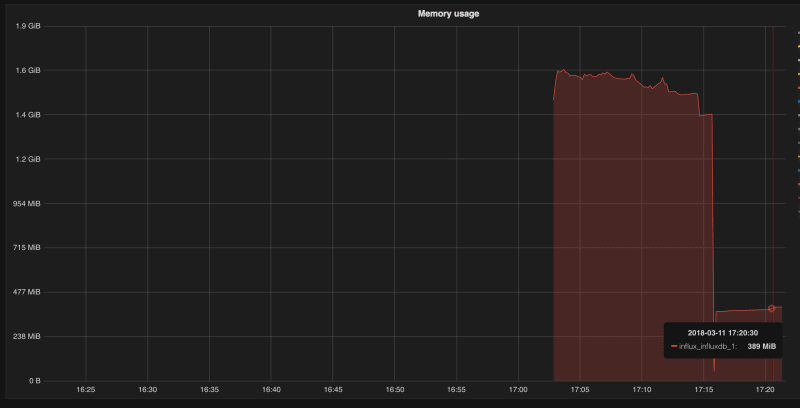
The result? Pretty good.

Posted on January 4, 2019
Join Our Newsletter. No Spam, Only the good stuff.
Sign up to receive the latest update from our blog.


