Let's Debug a Node.js Application

Julián Duque
Posted on August 5, 2020

There are always challenges when it comes to debugging applications. Node.js' asynchronous workflows add an extra layer of complexity to this arduous process. Although there have been some updates made to the V8 engine in order to easily access asynchronous stack traces, most of the time, we just get errors on the main thread of our applications, which makes debugging a little bit difficult. As well, when our Node.js applications crash, we usually need to rely on some complicated CLI tooling to analyze the core dumps.
In this article, we'll take a look at some easier ways to debug your Node.js applications.
Logging
Of course, no developer toolkit is complete without logging. We tend to place console.log statements all over our code in local development, but this is not a really scalable strategy in production. You would likely need to do some filtering and cleanup, or implement a consistent logging strategy, in order to identify important information from genuine errors.
Instead, to implement a proper log-oriented debugging strategy, use a logging tool like Pino or Winston. These will allow you to set log levels (INFO, WARN, ERROR), allowing you to print verbose log messages locally and only severe ones for production. You can also stream these logs to aggregators, or other endpoints, like LogStash, Papertrail, or even Slack.
Working with Node Inspect and Chrome DevTools
Logging can only take us so far in understanding why an application is not working the way we would expect. For sophisticated debugging sessions, we will want to use breakpoints to inspect how our code behaves at the moment it is being executed.
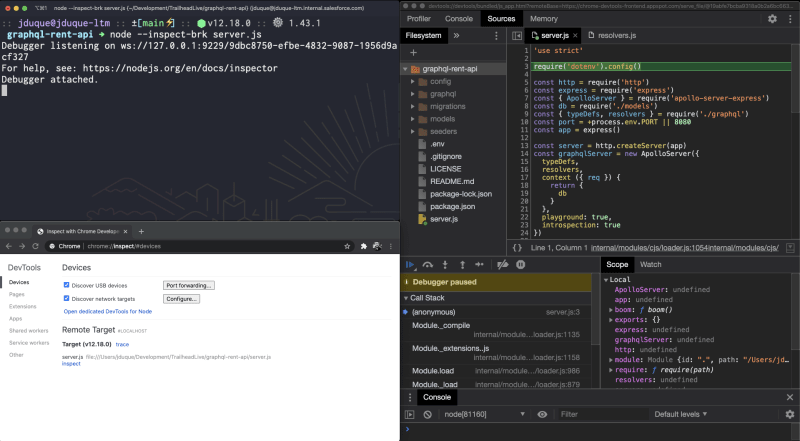
To do this, we can use Node Inspect. Node Inspect is a debugging tool which comes with Node.js. It's actually just an implementation of Chrome DevTools for your program, letting you add breakpoints, control step-by-step execution, view variables, and follow the call stack.
There are a couple of ways to launch Node Inspect, but the easiest is perhaps to just call your Node.js application with the --inspect-brk flag:
$ node --inspect-brk $your_script_name
After launching your program, head to the chrome://inspect URL in your Chrome browser to get to the Chrome DevTools. With Chrome DevTools, you have all of the capabilities you'd normally expect when debugging JavaScript in the browser. One of the nicer tools is the ability to inspect memory. You can take heap snapshots and profile memory usage to understand how memory is being allocated, and potentially, plug any memory leaks.
Using a supported IDE
Rather than launching your program in a certain way, many modern IDEs also support debugging Node applications. In addition to having many of the features found in Chrome DevTools, they bring their own features, such as creating logpoints and allowing you to create multiple debugging profiles. Check out the Node.js' guide on inspector clients for more information on these IDEs.
Using NDB
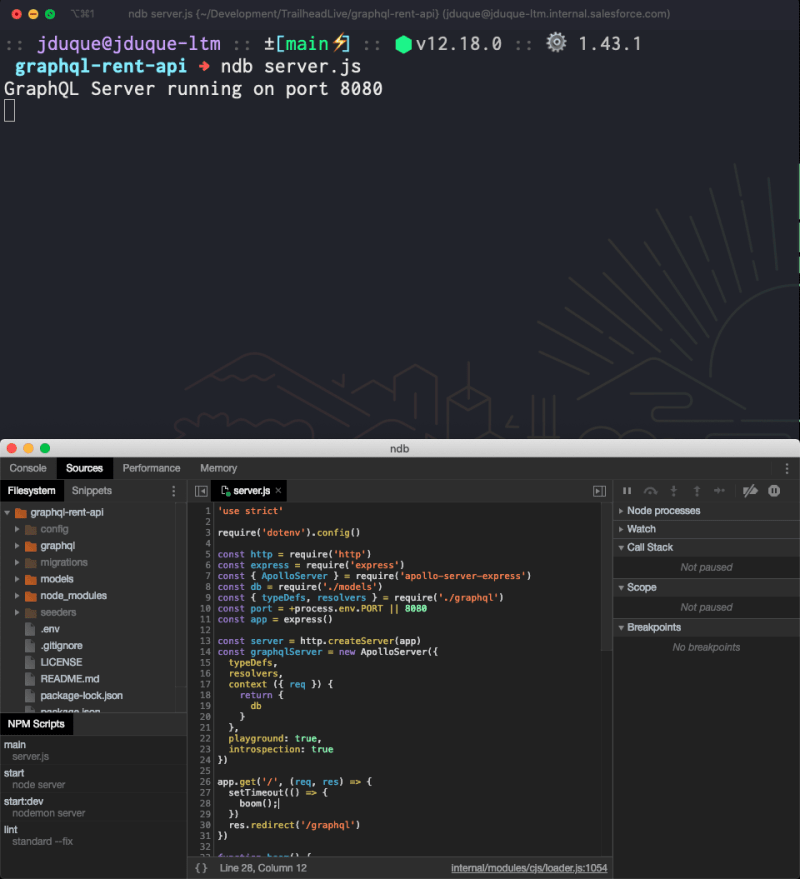
Another option is to install ndb, a standalone debugger for Node.js. It makes use of the same DevTools that are available in the browser, just as an isolated, local debugger. It also has some extra features that aren't available in DevTools. It supports edit-in-place, which means you can make changes to your code and have the updated logic supported directly by the debugger platform. This is very useful for doing quick iterations.
Post-Mortem Debugging
Suppose your application crashes due to a catastrophic error, like a memory access error. These may be rare, but they do happen, particularly if your app relies on native code.
To investigate these sorts of issues, you can use llnode. When your program crashes, llnode can be used to inspect JavaScript stack frames and objects by mapping them to objects on the C/C++ side. In order to use it, you first need a core dump of your program. To do this, you will need to use process.abort instead of process.exit to shut down processes in your code. When you use process.abort, the Node process generates a core dump file on exit.
To better understand what llnode can provide, here is a video which demonstrates some of its capabilities.
Useful Node Modules
Aside from all of the above, there are also a few third-party packages that we can recommend for further debugging.
debug
The first of these is called, simply enough, debug. With debug, you can assign a specific namespace to your log messages, based on a function name or an entire module. You can then selectively choose which messages are printed to the console via a specific environment variable.
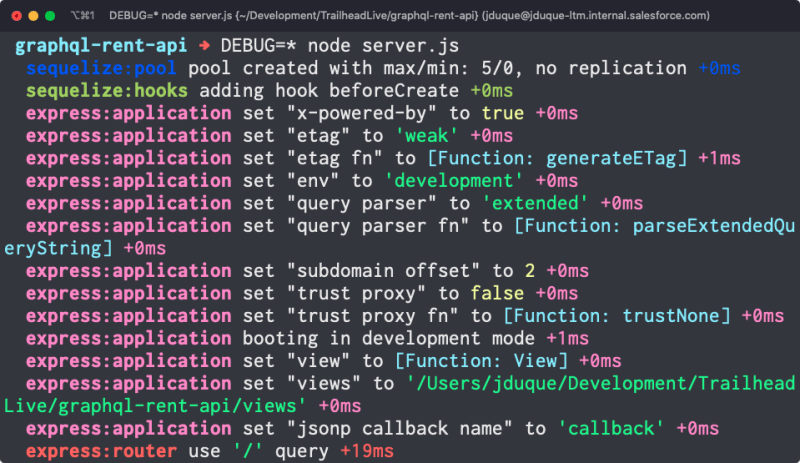
For example, here's a Node.js server which is logging several messages from the entire application and middleware stack, like sequelize, express:application, and express:router:
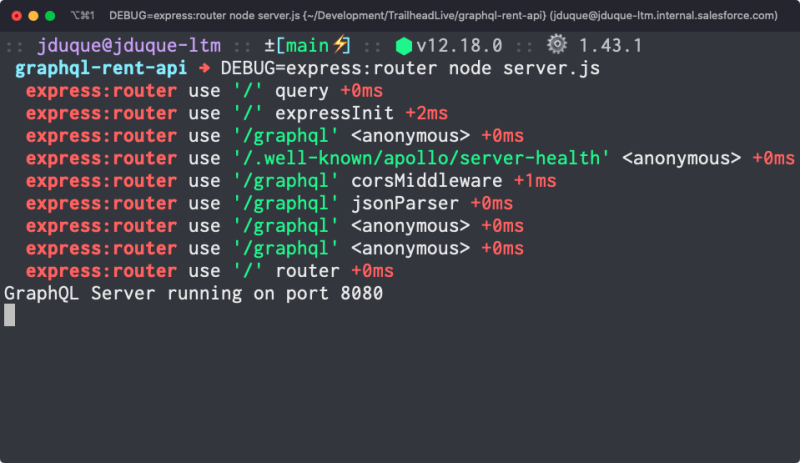
If we set the DEBUG environment variable to express:router and start the same program, only the messages tagged as express:router are shown:
By filtering messages in this way, we can hone in on how a single segment of the application is behaving, without needing to drastically change the logging of the code.
trace and clarify
Two more modules that go together are trace and clarify.
trace augments your asynchronous stack traces by providing much more detailed information on the async methods that are being called, a roadmap which Node.js does not provide by default. clarify helps by removing all of the information from stack traces which are specific to Node.js internals. This allows you to concentrate on the function calls that are just specific to your application.
Neither of these modules are recommended for running in production! You should only enable them when debugging issues in your local development environment.
Find out more
If you'd like to follow along with how to use these debugging tools in practice, here is a video recording which provides more detail. It includes some live demos of how to narrow in on problems in your code. Or, if you have any other questions, you can find me on Twitter @julian_duque!

Posted on August 5, 2020
Join Our Newsletter. No Spam, Only the good stuff.
Sign up to receive the latest update from our blog.


