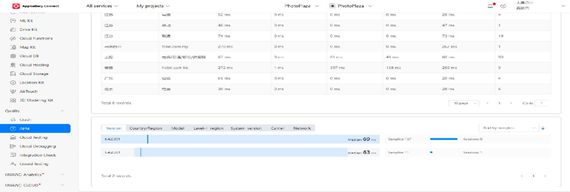
Huawei APM Network Analysis displaying the number of sessions as 0? Why?!

Zachary Powell
Posted on November 4, 2021
The APM service from AppGallery Connect can monitor and test the performance of apps running on devices and provide readable reports in real-time, which is a very practical feature.
Once integrated the analysis reports are very comprehensive, especially the ANR analysis and Network analysis reports.
However, there is one problem that many people find, which is that the number of sessions recorded in the network analysis appears as 0 even though the number of network requests, which appears as Samples in the following figure, was over one hundred.
So why might this be the case? Is there something going wrong? A bug? What should we do about it?! Well, let's start by understanding the sessions.
A session is an information interchange between the user and app. For example, when the user moves the app from the background to the foreground, a new session is generated.
To prevent frequently collected sessions from consuming too much traffic and CPU resources, APM performs sampling control on sessions.
Currently, the default session sampling rate is 1%.
The default session sampling rate is the preferred method when used online. But you can also increase it in the offline test by using the following code:
Click here to view more details about how to set the session sampling rate.
So importantly not every session is sent back for reporting, and by default, it’s a very small number (1%). If you find that your app is getting a very low number of sessions, which is particularly the case during testing when it might just be running on one device increasing the sample percentage will help make sure you are getting sessions results in the reports.
If you want to learn more about APM, please refer to:
APM Development Guide
and
APM API Reference

Posted on November 4, 2021
Join Our Newsletter. No Spam, Only the good stuff.
Sign up to receive the latest update from our blog.
