How to Debug Redux in a React-Native App

Andres Urdaneta
Posted on February 15, 2021
Note: You can read this article in spanish
After a lot of —s t r u g g l e— trying to understand how all these dev tools work together in order to debug my first React Native Application I got so stressed for not being able to just get to know what was in my Redux Tree that I decided to document the solution that worked for me.
— After all it wasn't that complicated, it's just that the docs weren't clear enough for me... and you know when you just go nuts with something simple? Well... —
That being said…
In this blog I'm going to show you how to debug a React Native application using the Chrome Extension: Redux DevTools Extension.
Assuming that you already have your React Native project set up with Redux and a middleware (i.e thunk). (I mean, installed as dev dependencies and your Redux store already setup);
Installing needed dependencies
We are going to install the following dependencies:
-
React-native-debugger:
This is a standalone app that you are going to need to install with brewinstall --cask react-native-debugger -
Redux DevTools Chrome Extension
&&redux-devtools-extension
This is a tool that you are going to need to install as a Chrome Extension in your Chrome Web Browser and also as a dev dependencie in your project.First, head over to the Chrome Web Store and install the Redux DevTools.
Then, now and finally we’ll head to the root of our project and install the dev dependencies:
npm install redux-devtools-extension remote-redux-devtools
Once finished installing the dependencies mentioned above we’ll take a look at the JavaScript file where we configure our redux store. Commonly named as configureStore.js or store.js.
Configuring our R e d u x S t o r e
If you setup your store with middeware and enhancers like redux-thunk, or similar: Let's use the composeWithDevTools export from redux-devtools-extension, and our store would look more or less like this:
// configureStore.js

import { createStore, applyMiddleware } from 'redux';
import { composeWithDevTools } from 'remote-redux-devtools';

const store = createStore(
    reducer,
    composeWithDevTools(applyMiddleware(...middleware),
  // other store enhancers if any
));
If you are not using middleware and/or enhancers then your store should look like this:
// configureStore.js

import { createStore, applyMiddleware, compose } from 'redux’;

const store = createStore(reducer, compose(
  applyMiddleware(...middleware),
  // other store enhancers if any
));
Notice that in the second example we don’t need to use the composeWithDevTools export. That’s the only difference. The reason behind this is that the composeWithDevTools function makes the actions dispatched from Redux DevTools flow to the middleware (something to take a deep look if you want to go down that rabbit hole).
Launching the React Native Debugger
There are two ways of accessing the React Native Debugger and they both are kinda the same, it’s just matter of preference:
-
The React Native Debugger runs by default in the port
8081, you can just open your terminal and run the following command:“rndebugger://set-debugger-loc?host=localhost&port=8081”or
-
Head over to your app root directory and open the
package.json. In the“scripts”section add the following:”debug": "open 'rndebugger://set-debugger-loc?host=localhost&port=8081’”
By now your `package.json` should look something like this:
"scripts": {
"android": "react-native run-android",
"ios": "react-native run-ios",
"start": "react-native start",
"test": "jest",
"lint": "eslint .",
"debug": "open 'rndebugger://set-debugger-loc?host=localhost&port=8081'"
}
And then in your app root directory run the following command:
npm run debug
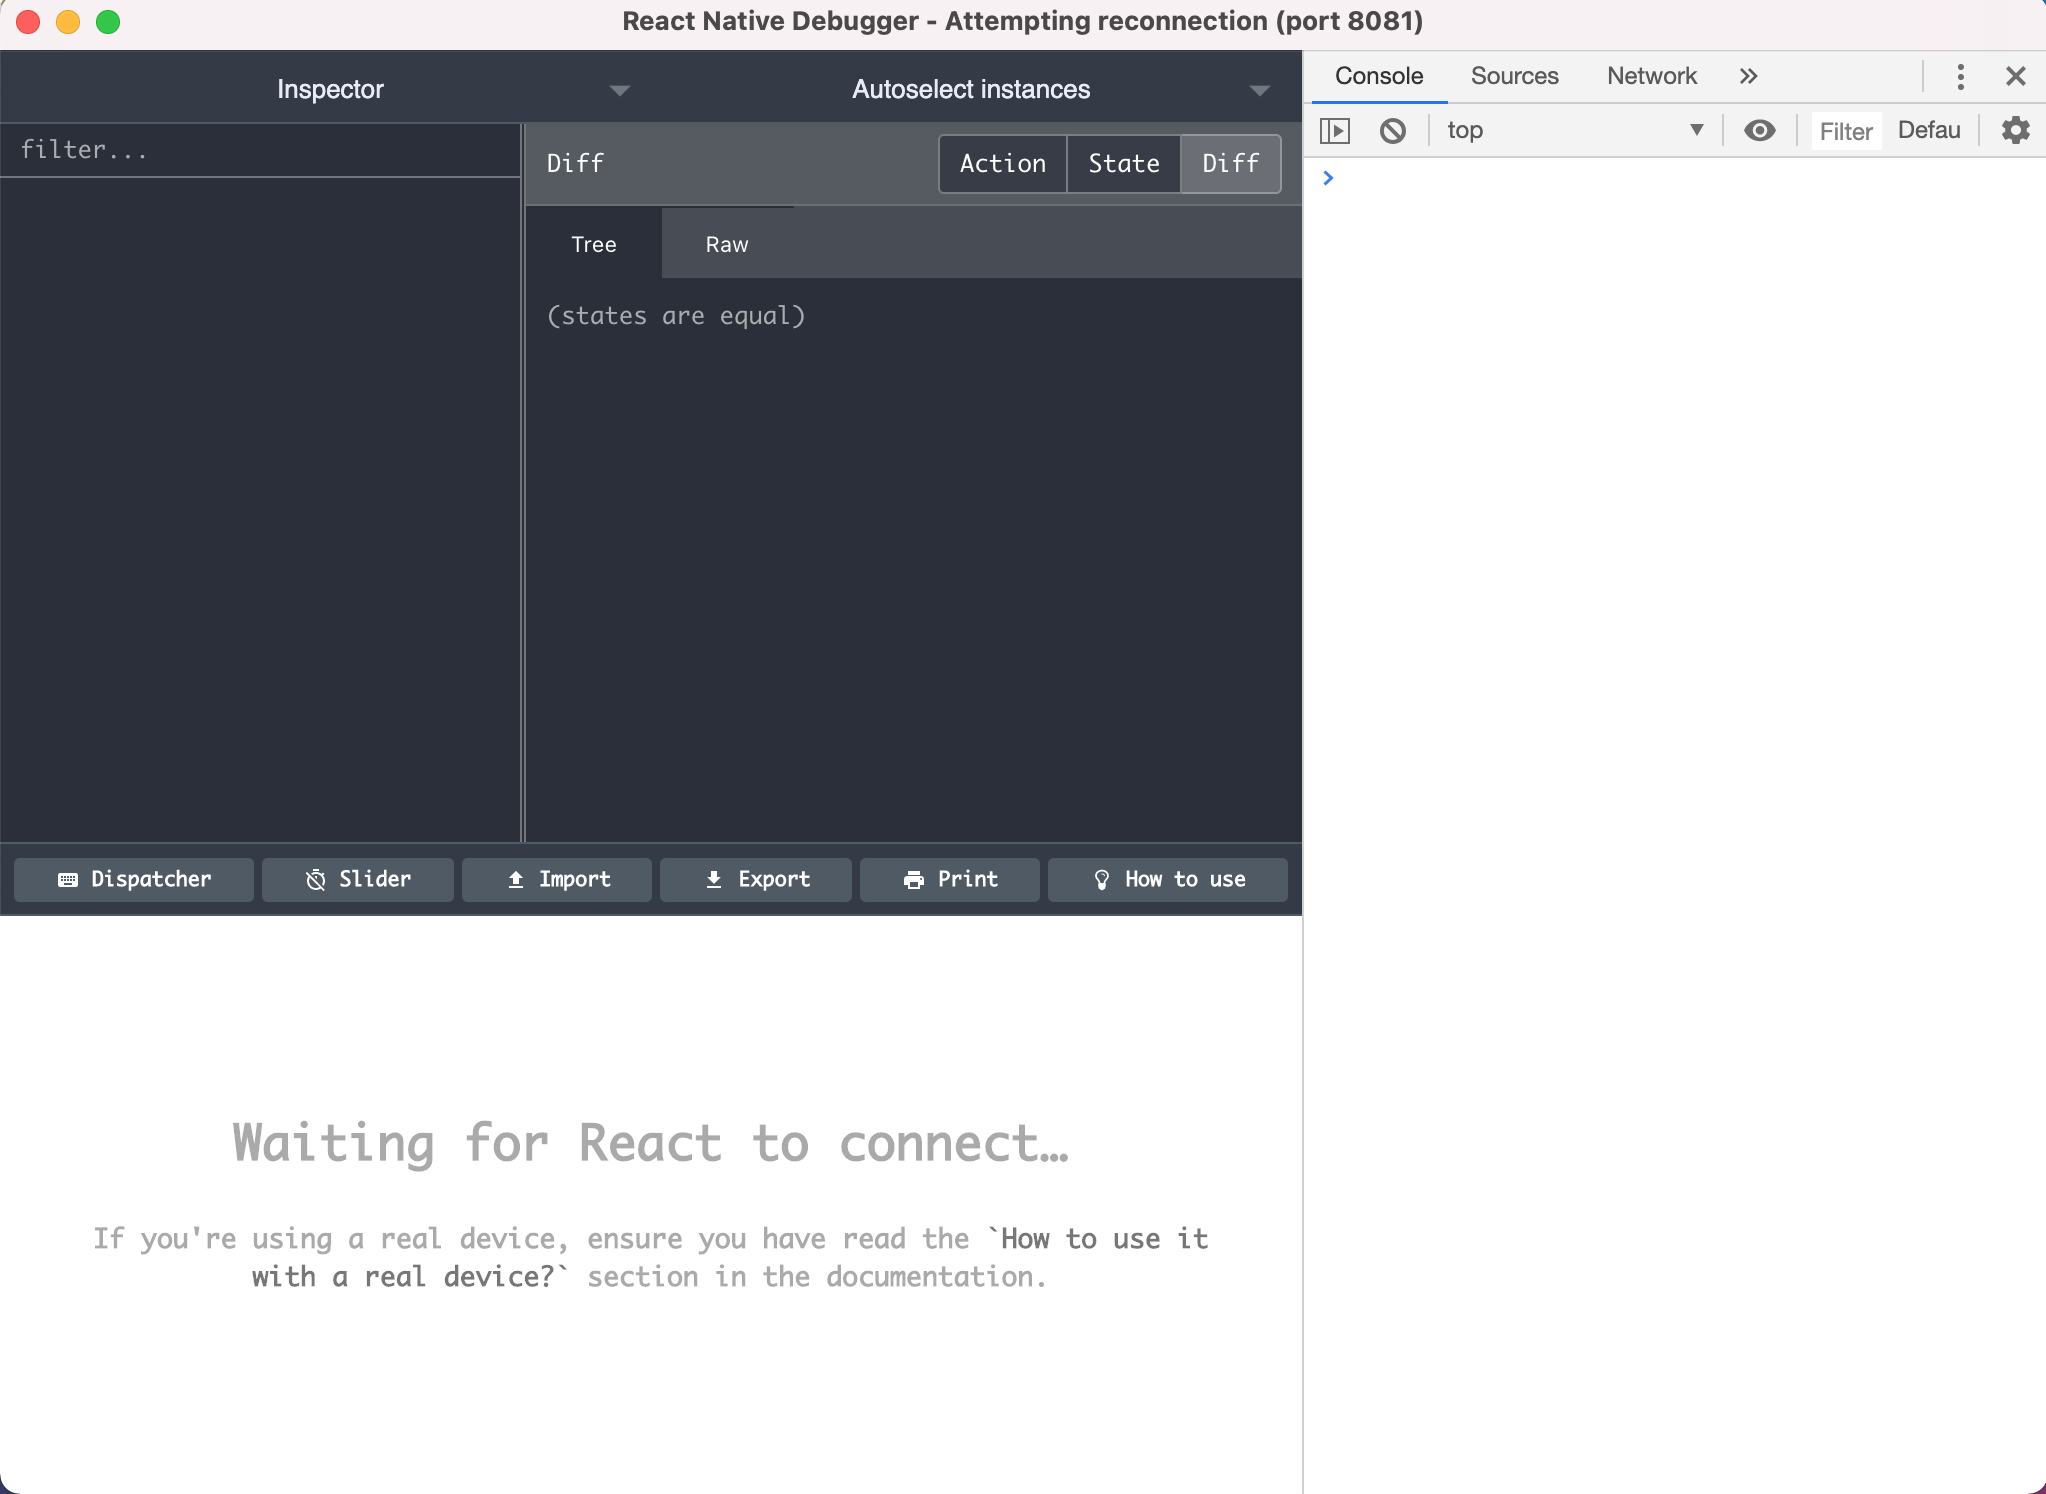
This should open the **React Native Debugger** window.

## Accesing the Developer Menu
Once launched the **React Native Debugger** head over to your project in your text editor and launch your app in the device simulator (in my case `npm run ios` or `npm run android`). Once the app opened, by using the shortcut `cmd+d` in the iOS simulator or `cmd+m` when running in an Android emulator, the Developer Menu should open. Click the **“Debug”** option.
And _Voilà_!
This should get your **RNDebugger** connected with your application. Now you are able to debug your app overall by taking advantage of the Chrome DevTools but also the reasons you came here... To check and debug your _freaking_ **Redux Tree**.

Posted on February 15, 2021
Join Our Newsletter. No Spam, Only the good stuff.
Sign up to receive the latest update from our blog.


