Debugging @track and @api properties in Lightning Web Components(LWC) using Chrome Dev Tools Formatter

David
Posted on July 14, 2019

Lightning Web Components (LWC) @api and @track decorators make component rendering a breeze, but they can be tricky to debug. The reason they can be tricky is because they are implemented using ES6 Proxies. Proxies allow LWC to transparently know what properties are being rendered in your template but they are tricky to inspect in the Chrome Dev Tools. The best approach to debugging @api and @track properties is to enable the custom dev formatter that comes out of the box with LWC.
Inspecting with Dev Formatter Disabled
For example, let's say we have a simple component that contains a single @track property:
import { LightningElement, track } from 'lwc';

export default class App extends LightningElement {
    @track property = { value: 'Hello World' }
}
When we inspect property, Chrome will include all kinds of information about the proxy that is used to implement @track:
Inspecting with Dev Formatter Enabled
After we enable the custom dev formatter, our debugging experience becomes much better:
Enabling Custom Dev Formatter
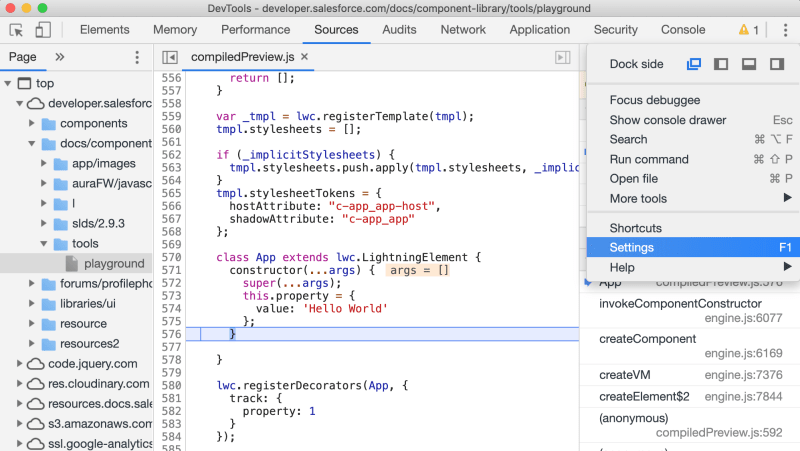
Enabling the custom dev formatter is easy:
|
1) Open the Web Inspector 2) Open the Web Inspector Settings |

|
| 3) Scroll down to "Console" section and check "Enable Custom Formatters" |

|
Happy Coding!

Posted on July 14, 2019
Join Our Newsletter. No Spam, Only the good stuff.
Sign up to receive the latest update from our blog.
Related

July 14, 2019

