HOW TO: Google Sheets and Apps Script for time management

Danko
Posted on May 29, 2021
Apps Script or AppScript (as I like to call it from now on) by Wikipedia's definition is
A scripting platform developed by Google for light-weight application development in the Google Workspace platform [...] It is based on JavaScript 1.6, but also includes some portions of 1.7 and 1.8 and a subset of the ECMAScript 5 API. Apps Script projects run server-side on Google's infrastructure.
In other words, with this platform you can run JavaScript-like code inside your other Google applications (like Calendar, Docs, Drive, Gmail, Sheets, and Slides) in order to automate certain tasks just by running a script. It is a tool so powerful you can even build Web Apps!
In this tutorial you will learn how to use it to build a dynamic time-management schedule using Google Sheets:
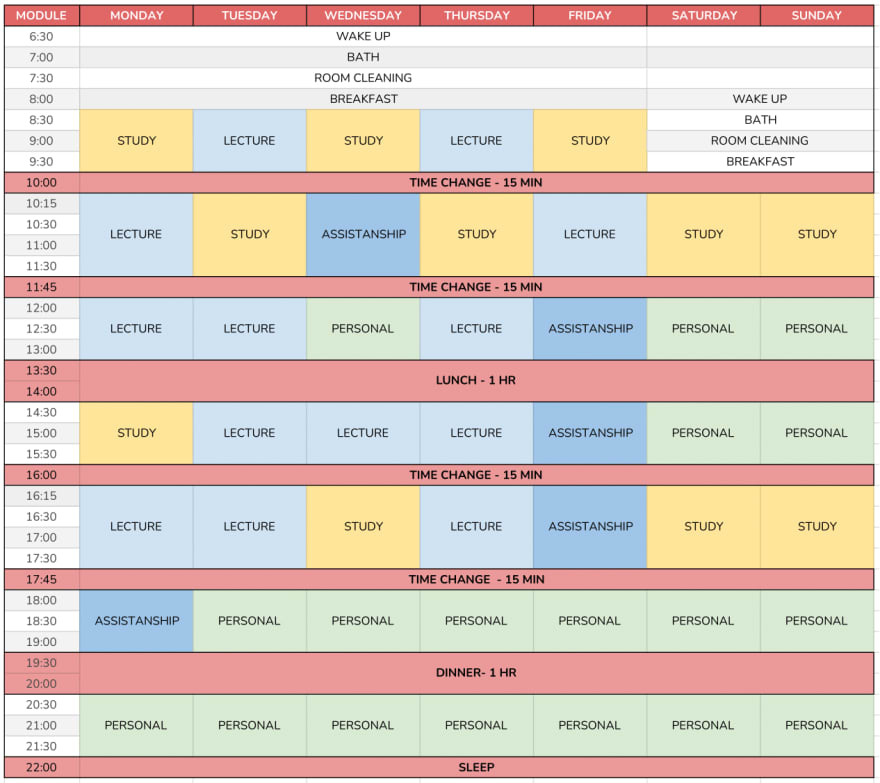
- Open a new Google Sheets and create your schedule in a way where every row represents a time lapse that fits your needs. Here is an example of mine:
Is important to note that for every type of activity I have a distinctive color associated to it (STUDY = YELLOW, PERSONAL = GREEN, etc). Also, by looking at the image you can tell that every activity in this particular schedule takes 1.5 hours, this is just to make the maths easier after.
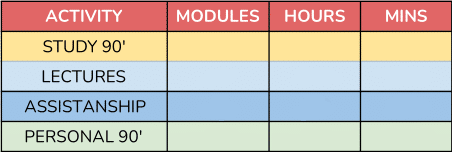
- Once the schedule is done, create a table next to your schedule just like this:
As you can see, I used the exact same colors to map the activites. The goal here will be to create a program capable of counting the different MODULES in the schedule by color so we can automatically calculate how much time is spent in a given activity, that's why is important to stablish your time lapses beforehand. This table (specifically the column ACTIVITY) will serve as a reference map for the colors and activities in the script.
Now, go to the
Toolstab in the sheet document and selectScript Editor. This will automatically open the AppScript platform. Then, go toFilesection, click on the+button and selectApps Scriptto create a new script for your sheet. This is when the fun starts.Once that is completed, the structure of the script is very simple: first, we create a function that is capable of counting the number of modules in the schedule given a specific color.
function countBackgrounds(colorReference) {
 var book = SpreadsheetApp.getActiveSpreadsheet();
 var sheet = book.getActiveSheet();
 var range_input = sheet.getRange("B2:H38"); /* The reference where the Schedule is stored */
 var cell_colors = range_input.getBackgroundColors(); /* Fetches all the colors in that range */
 var color = colorReference;
 var count = 0; /* counter */
 /* cell_colors is a matrix of colors */
 for(var r = 0; r < cell_colors.length; r++) {
   for(var c = 0; c < cell_colors[r].length; c++) {
     if(cell_colors[r][c] == color) { /* If there's a match adds 1 to the counter */
       count = count + 1;
     }
   }
 }
  return count
}
- The next step is to fetch the color references we are going to give to
countBackgroundsas argument. This is can be done with these lines of code:
var ss = SpreadsheetApp.getActiveSpreadsheet();
var sheet = ss.getSheets()[0];
var results = ["K2", "K3", "K4","K5"]; /* The reference where the total countings will be written */
var colors = sheet.getRange("J2:J5").getBackgrounds(); /* The reference of the colors we are using */

for(var i in colors){
  sheet.getRange(results[i]).setValue(countBackgrounds(colors[i].toString()));
}
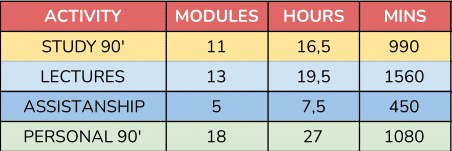
- Now you are ready to run your script and see what happens but, before your script actually executes, Google will ask your permit for reading and modifying your Google Sheets data. After doing that (and your math for the time conversions) you will have a table looking like this:
Cool, right? You can add a Pie Chart or a Bar Chart that references this table and you will have a complete time-management schedule!
Don't forget to give a ❤️ if you found this useful :)

Posted on May 29, 2021
Join Our Newsletter. No Spam, Only the good stuff.
Sign up to receive the latest update from our blog.


