Open source public fund experiment - One and a half years update

Serkan Holat
Posted on July 27, 2023
Sponsored by
First, the exciting news: I am delighted to share that I started working with the Open Source Collective and Ecosyste.ms teams on this research, and the Open Source Collective is the sponsor of the following updates.
Hopefully more to come on this collaboration, so stay tuned!
Unresolved question: How should open technologies be financed?
When it comes to open technologies, such as open source software, there is a long-standing debate about how to finance them and by whom.
My humble conclusion is straightforward. Expecting thousands of companies to contribute back to the ecosystems they consume without coordination is a hopeless dead end. Open technologies fall under the public goods category; therefore, we should finance them with public money, similar to public roads, bridges, or libraries.
However, the nature of open technologies is pushing us to innovate over our funding models; even though we should recognize them as a new type of digital, public goods, they are produced by the private sector, which is a combination that happens for the first time on a large and continues scale.
This unique state brings us a new challenge; developing a scalable public funding structure to finance an entire and ever-changing market.
Last year, I started an Agile Public Fund experiment to dive into the practical side of this challenge; study and demo a funding algorithm that distributes a certain amount to open source initiatives based on criticality and usage metrics. The journey continues with new allies, some updates, and with more challenges to come.
As usual, your feedback is priceless; don't hesitate to get in touch with any comments, questions, or ideas.
Updates
I had a chance to improve the data, process, and algorithms in the last couple of weeks. You can see all the changes on the Open source public fund experiment document on Google Sheets.
TL;DR: I could extend the Criticality Score algorithm with usage metrics from Ecosyste.ms API and apply it to all open source accounts under the Open Collective, so we have a new ranking now! I also made it possible to change the weights of each parameter so that you can try the algorithm by yourself.
Open Collective data refresh
Refreshed the accounts list from Open Collective API and included the country and yearly budget in the data. There are now 4729 accounts with a code repository.
Criticality Score's latest version
Updated my local Criticality Score repository to the latest version. The new version is written in the Go language instead of Python, and it has a second algorithm that calculates the score by getting the "dependent count" data from the Open Source Insights (deps.dev) API.
Manual score calculations
Recreated all formulas for calculating the scores under the "Criticality Score - Results" sheet. Now it is possible to play around with the weight of each parameter and see the new results directly within the document.
New config with the Ecosyste.ms data
Decoupling the data collection and the score calculation made extending the data from other custom resources easy. Thus, I retrieved each repository's "dependent_repos_count" data from the Ecosyste.ms API and created a new algorithm configuration. This one replaces the deps.dev's "dependent count" parameter.
Now there are three different algorithms for score calculation, and you can see their parameters under the "Criticality Score - Config" sheet:
- original_pike - Yellow: The default algorithm from the Criticality Score.
- pike_deps.dev - Green: The second algorithm from the Criticality Score includes the "dependent count" from deps.dev as an extra parameter.
- ecosyste.ms - Blue: The new algorithm that uses the "dependent_repos_count" data from the Ecosyste.ms API and replaces the deps.dev's "dependent count" parameter.
Changing a parameter under the Config sheet updates the scores under the Results. Feel free to copy the document and try it yourself.
Stats
Under the new Stats sheet, you can see a quick overview of the data in the other sheets:
- General stats of the Open Collective accounts and repositories
- Budget stats of the accounts
- The languages of the repositories
- The licenses of the repositories
- The countries of the accounts
- The ecosystems of the repositories
- Top 10 repositories of each algorithm
Winners
This sheet shows the history and the details of the three winners I randomly choose monthly to test the algorithm.
Budgets
I plan to follow the budget changes of the Open Collective accounts in time under this new sheet.
The process and the helper tools
Below is a brief list of actions to prepare the data and the final results. One critical remark is that currently, the process only works with GitHub repositories, so I exclude non-GitHub ones—hopefully, a detail to improve in the future.
- Retrieve the accounts data from Open Collective API to create Accounts and Budgets sheets,
- Call GitHub API to find the most starred repositories of each GitHub user, which you can find under the "GitHub - Top repos" sheet,
- Run the Criticality Tool to get the data points of each repository, which are stored under the "Criticality Score - Results" sheet,
- Call the Lookup endpoint of the Ecosyste.ms API to get the additional "dependent_repos_count" data of each repository and combine it with the other parameters under the "Criticality Score - Results" sheet,
- Once the data is in place, the existing formulas in the "Criticality Score - Results" sheet calculate the scores.
- Last, I will be updating the data and the scores once a month.
Quick links:
Stats overview
Here are some stats that stand out:
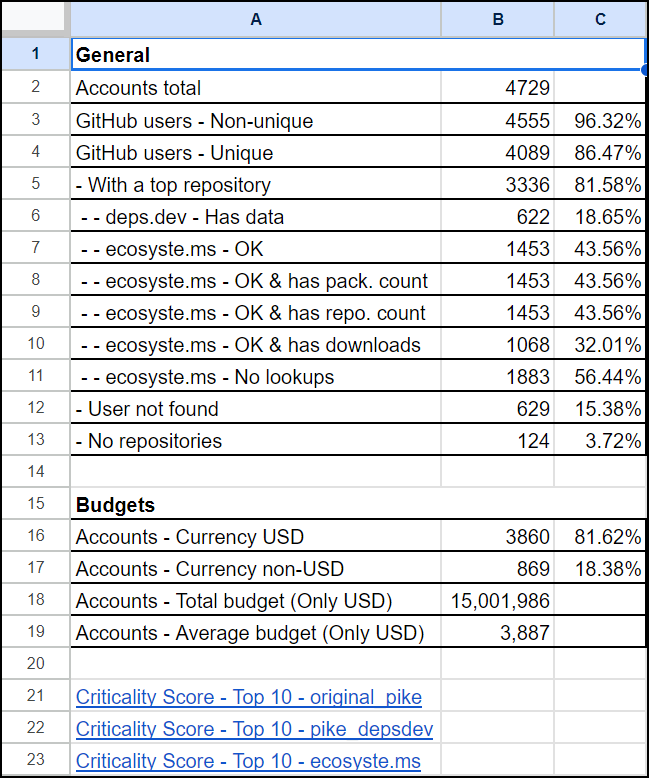
- The total number of Open Collective accounts with a code repository is 4729.
- 96.32% of those accounts use GitHub as their code repository.
- However, 15.38% of the GitHub username are not valid / don't exist, which is a massive number. It would be handy if Open Collective could add a code repository/link verification method or ask the users to update their profile details occasionally.
- 81.62% of the accounts use USD as their currency. Their yearly budget is about $15 million, and the average is $3,887 per account, probably not even one percent of the ideal figures.
- The language of almost one-third of the repositories is JavaScript. Python comes second, and PHP is third.
- MIT dominates the license list with 41.91%, of which there are 27 different licenses. 15.41% of the repositories don't have any.
- Regarding the accounts' countries, the United States leads the list with 11.4%. China follows with 2.9%, the United Kingdom at 2.8%, Germany at 2.7%, and India at 2.5%.
- The Ecosyste.ms search returns 1453 matches out of 3336 unique repositories. Out of this data, npm is the top ecosystem with 46.94%, go is the second with 13.35%, and PyPI is third with 9.70%.
- And last, here are the top five repositories with the highest criticality score based on Ecosyste.ms config:
You can see the full ranking of each algorithm and more under the Stats sheet.
Winners overview
I randomly choose three open source collectives from the accounts list every month to test the algorithm results and reach out to the open source entrepreneurs. I distribute an amount to each collective based on their scores.
Since the start, it's been 19 rounds, and using experiment as my excuse, I have proudly invested $4259 in 57 open source collectives.
As a side experiment, I determine the amount to distribute based on new social media followers. Six months ago, I included Mastodon and LinkedIn next to Twitter and gained 178 followers on all three platforms since then.
What's next?
In short, a lot! Next to telling a more compelling story about why we should invest in open technologies and why public money is the best option to achieve that, there are many practical items on the list:
- Most under-appreciated: Find the accounts with the highest score and minimum yearly budget,
- Permissive the better: Categorize permissive and copy-left licenses and add a license parameter to the algorithm as an experiment (feedback is welcome),
- Repositories vs. releases: Combine the repository data with their release information and improve the algorithm by including the release metrics.
- National public funds simulation: Categorize the accounts based on each country and simulate fund distribution per country.
Thanks for tuning in, and I hope you enjoy the ride as much as I do. Wish me luck, and see you next time!

Posted on July 27, 2023
Join Our Newsletter. No Spam, Only the good stuff.
Sign up to receive the latest update from our blog.

