Alex Patterson
Posted on April 23, 2020

Debug Angular 9 in Chrome Console
These functions are exposed via the global
ng"namespace" variable automatically when you import from@angular/coreand run your application in development mode. These functions are not exposed when the application runs in a production mode.
Chrome Console Utilities
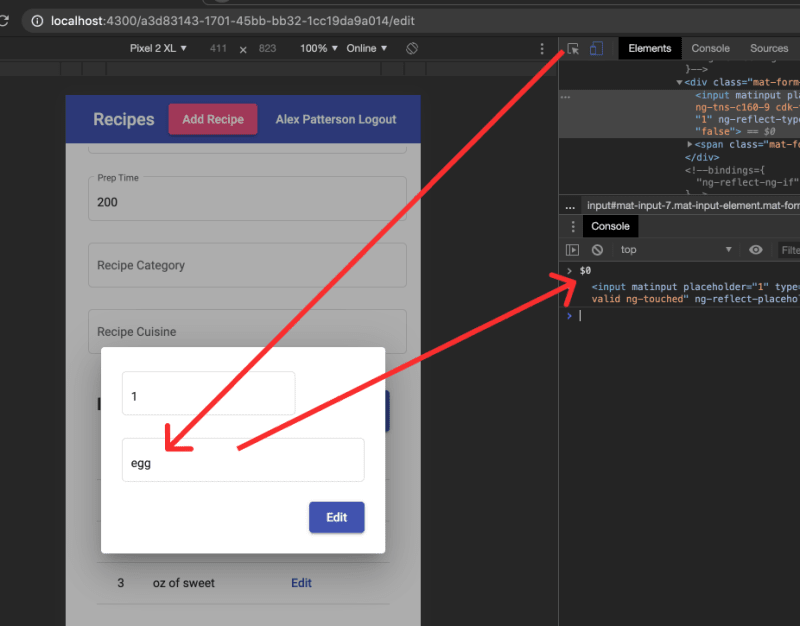
The great part about using the Chrome console is that it gives you access any DOM element that you have selected. For the last item you can get the reference by typing $0 in the console. Below you will see that you can use the selection tool to easily find the element. Once this is selected you can then use $0 as it will be the latest in your selection history. You can read further about this in Console Utilities API Reference.
Getting the Angular Component reference
Now that we know how to get a DOM reference we can use the Angular @angular/core/global utilities, you can find more details here: https://angular.io/api/core/global#entry-point-exports.
Using ng.getContext($0) we can access the angular component instance.
// Get this component
let dialogComponent = ng.getContext($0)

// Get parent component
let dialogParentComponent = ng.getOwningComponent($0)
Changing values in the Component
Now that you have a reference to the component using let dialogComponent = ng.getContext($0) we can now update the properties within the component. For this example we will change the qty in our recipeIngredient object.
dialogComponent.data.recipeIngredient.qty = 5
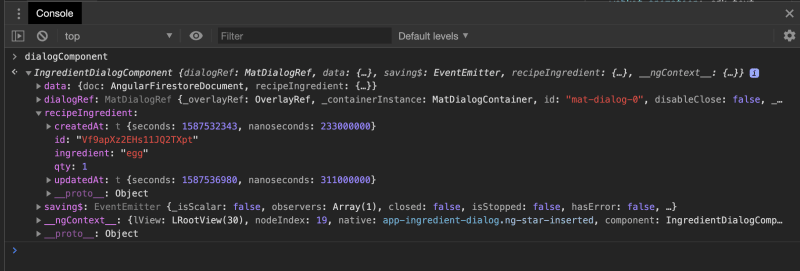
You should also note that you can display the entire component as well incase you are unaware of the structure.
Making Component Update
In order to get the value change to show within the component you must trigger change detection.
// Apply change detection
ng.applyChanges(dialogComponent)

Posted on April 23, 2020
Join Our Newsletter. No Spam, Only the good stuff.
Sign up to receive the latest update from our blog.


