Kubernetes Logging in Production

Kentaro Wakayama
Posted on October 26, 2021

Historically, in monolithic architectures, logs were stored directly on bare metal or virtual machines. They never left the machine disk and the operations team would check each one for logs as needed.
This worked on long-lived machines, but machines in the cloud are ephemeral. As more companies run their services on containers and orchestrate deployments with Kubernetes, logs can no longer be stored on machines and implementing a log management strategy is of the utmost importance.
Logs are an effective way of debugging and monitoring your applications, and they need to be stored on a separate backend where they can be queried and analyzed in case of pod or node failures. These separate backends include systems like Elasticsearch, GCP’s Stackdriver, and AWS’ Cloudwatch.
Storing logs off of the cluster in a storage backend is called cluster-level logging. In this article we’ll discuss how to implement this approach in your own Kubernetes cluster.
Logging Architectures
In a Kubernetes cluster there are two main log sources, your application and the system components.
Your application runs as a container in the Kubernetes cluster and the container runtime takes care of fetching your application’s logs while Docker redirects those logs to the stdout and stderr streams. In a Kubernetes cluster, both of these streams are written to a JSON file on the cluster node.
These container logs can be fetched anytime with the following command:
kubectl logs podname
The other source of logs are system components. Some of the system components (namely kube-scheduler and kube-proxy) run as containers and follow the same logging principles as your application.
The other system components (kubelet and container runtime itself) run as a native service. If systemd is available on the machine the components write logs in journald, otherwise they write a .log file in /var/log directory.
Now that we understand which components of your application and cluster generate logs and where they’re stored, let’s look at some common patterns to offload these logs to separate storage systems.
Logging Patterns
The two most prominent patterns for collecting logs are the sidecar pattern and the DaemonSet pattern.
1. DaemonSet pattern
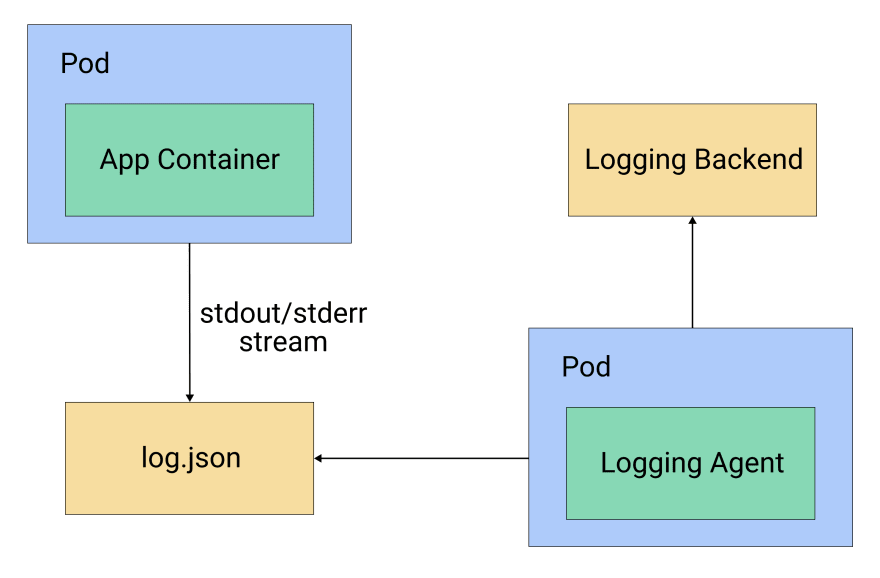
In the DaemonSet pattern, logging agents are deployed as pods via the DaemonSet resource in Kubernetes. Deploying a DaemonSet ensures that each node in the cluster has one pod with a logging agent running. This logging agent is configured to read the logs from /var/logs directory and send them to the storage backend. You can see a diagram of this configuration in figure 1.
Figure 1: A logging agent running per node via a DaemonSet
2. Sidecar pattern
Alternatively, in the sidecar pattern a dedicated container runs along every application container in the same pod. This sidecar can be of two types, streaming sidecar or logging agent sidecar.
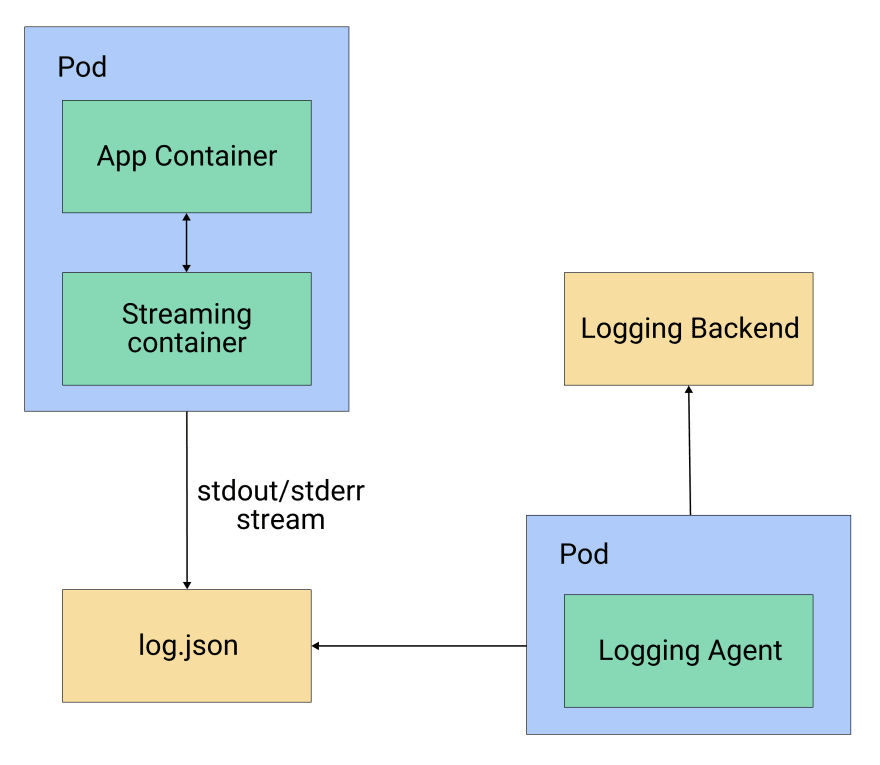
The streaming sidecar is used when you are running an application that writes the logs to a file instead of stdout/stderr streams, or one that writes the logs in a nonstandard format. In that case, you can use a streaming sidecar container to publish the logs from the file to its own stdout/stderr stream, which can then be picked up by Kubernetes itself.
The streaming sidecar can also bring parity to the log structure by transforming the log messages to standard log format. You can see this pattern in figure 2.
Figure 2: Streaming sidecar pattern
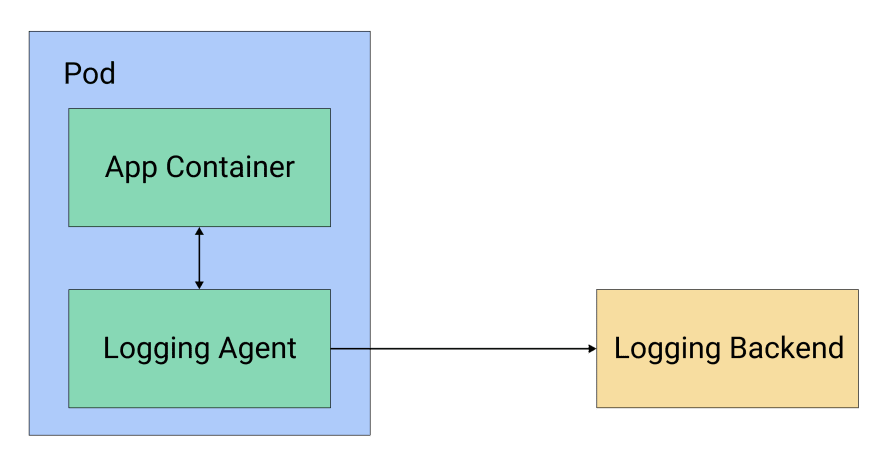
Another approach is the logging agent sidecar, where the sidecar itself ships the logs to the storage backend. Each pod contains a logging agent like Fluentd or Filebeat, which captures the logs from the application container and sends them directly to the storage backend, as illustrated in figure 3.
Figure 3: Logging agent sidecar pattern
Pros and Cons
Now that we’ve gone over both the DaemonSet and sidecar approaches, let’s get acquainted with the pros and cons of each.
1. DaemonSet (Node Level)
Pros
Node-level logging is easier to implement because it hooks into the existing file based logging and is less resource intensive than a sidecar approach as there are less containers running per node.
The logs are available via the kubectl command for debugging, as the log files are available to kubelet which returns the content of the log file.
Cons
Less flexibility in supporting different log structures or applications that write to log files instead of streams. You would need to modify the application log structure to achieve parity, or handle the difference in your storage backend.
Since they’re stored as JSON files on the node disk, logs can’t be held forever. You need to have a log rotation mechanism in place to recycle old logs. If you are using Container Runtime Interface, kubelet takes care of rotating the logs and no explicit solution needs to be implemented.
2. Sidecar
Pros
You have the flexibility to customize sidecars per application container. For example, an application might not have the ability to write to
stdout/stderr, or it might have some different logging format. In these cases, a sidecar container can bring parity to the system.If you’re using a logging agent sidecar without streaming, you don't need to rotate the logs because no logs are being stored on the node disk.
Cons
Running a sidecar for each application container is quite resource intensive when compared to node-level pods.
Adding a sidecar to each deployment creates an extra layer of complexity.
If you’re using a streaming sidecar for an application that writes its logs to files, you’ll use double the storage for the same logs because you’ll be duplicating the entries.
If you’re using a logging agent sidecar without streaming, you’ll lose the ability to access logs via
kubectl. This is becausekubeletno longer has access to the JSON logs.With a logging agent sidecar you also need a node-level agent, otherwise you won’t be able to collect the system component logs.
Putting Theory into Practice
Now that we’ve looked at the possible patterns for logging in a Kubernetes cluster, let’s put them into action. We’ll deploy dummy containers generating logs and create Kubernetes resources to implement the logging patterns we discussed above.
For this example we’ll use Fluentd as a logging agent, and we will install Elasticsearch for logging backend and Kibana for visualization purposes. We will install Elasticsearch and Kibana using Helm charts into the same cluster. Do note however that your storage backend should not be on the same cluster and we are doing it for demo purposes only. Thanks to Fluentd’s pluggable architecture, it supports various different sinks. That’s why the Elasticsearch backend can be replaced by any cloud-native solution, including Stackdriver or Cloudwatch.
1. Installing Elasticsearch and Kibana
We will deploy the Elasticsearch and Kibana using the official Helm charts which can be found here(Elasticsearch, Kibana). For installing via Helm you would need a helm binary on your path but installation of Helm is outside the scope of this post.
Let us start by adding helm repos.
helm repo add elastic https://helm.elastic.co
Next we will install the Elasticsearch and Kibana charts into our cluster.
helm install elasticsearch elastic/elasticsearch
helm install kibana elastic/kibana
This will install the latest version of Elasticsearch and Kibana in your cluster which can then be used as storage backend for your logs.
We have used the default values in our charts but you can change any parameter based on your needs when you are installing this in production.
2. DaemonSet
We will be deploying Fluentd as a DaemonSet. To keep the verbosity low, we won’t be creating a separate ServiceAccount and ClusterRole. But in a production environment, Fluentd pods should run with a separate service account with limited access.
You can deploy Fluentd as a DaemonSet by using following the Kubernetes resource:
apiVersion: extensions/v1beta1
kind: DaemonSet
metadata:
  name: fluentd
  namespace: kube-system
  labels:
    k8s-app: fluentd-logger
spec:
  template:
    metadata:
      labels:
        k8s-app: fluentd-logger
    spec:
      containers:
      - name: fluentd
        image: fluent/fluentd-kubernetes-daemonset:elasticsearch
        env:
        - name:  FLUENT\_ELASTICSEARCH\_HOST
          value: "elasticsearch-master"
        - name:  FLUENT\_ELASTICSEARCH\_PORT
          value: "9200"
        volumeMounts:
        - name: varlog
          mountPath: /var/log
        - name: dockerlogs
          mountPath: /var/lib/docker/containers
          readOnly: true
      volumes:
      - name: varlog
        hostPath:
          path: /var/log
      - name: dockerlogs
        hostPath:
          path: /var/lib/docker/containers
In this example, we’re mounting two volumes: one at /var/log and another at /var/log/docker/containers, where the system components and Docker runtime put the logs, respectively.
The image we are using is already configured with smart defaults to be used with DaemonSet, but you can change the configuration.
Save the above YAML resource in a file named fluentd-ds.yaml and apply the resource via the following command:
kubectl apply -f fluentd-ds.yaml
This will start a Fluentd pod on each node in your Kubernetes cluster.
Now we’ll see how to implement streaming and logging agent sidecar patterns.
3. Sidecar
First, let’s look at the streaming sidecar pattern when our application is writing logs to a file instead of stream. We’re running a sidecar to read those logs and write it back to the stdout/stderr stream.
apiVersion: v1
kind: Pod
metadata:
  name: my-app
spec:
  containers:
  - name: legacy-app
    image: busybox
    args:
    - /bin/sh
    - -c
    - >
      i=0;
      while true;
      do
        echo "$i: $(date)" >> /var/log/output.log;
        i=$((i+1));
        sleep 1;
      done
    volumeMounts:
    - name: varlog
      mountPath: /var/log
  - name: streaming-sidecar
    image: busybox
    args: \[/bin/sh, -c, 'tail -n+1 -f /var/log/output.log'\]
    volumeMounts:
    - name: varlog
      mountPath: /var/log
  volumes:
  - name: varlog
    emptyDir: {}
In this example, we have a dummy container writing logs to files in the /var/log directory of the container. Now these logs can’t be fetched by the container runtime, that’s why we implemented a streaming sidecar to tail the logs from the /var/log location and redirect it to the stdout stream.
This log stream will be picked up by the container runtime and stored as a JSON file at the /var/log directory on the node, which will in turn be picked up by the node-level logging agent.
Now, let’s look at the logging agent sidecar. In this pattern we’ll deploy Fluentd as a sidecar, which will directly write to our Elasticsearch storage backend.
Unfortunately, there is no prebuilt image with an Elasticsearch plugin installed, and creating a custom Docker image is out of the scope of this article. Instead, we’ll use the same Fluentd image that we used in the DaemonSet example.
apiVersion: v1
kind: Pod
metadata:
  name: my-app
spec:
  containers:
  - name: count
    image: busybox
    args:
    - /bin/sh
    - -c
    - >
      i=0;
      while true;
      do
        echo "$i: $(date)" >> /var/log/output.log;
        i=$((i+1));
        sleep 1;
      done
    volumeMounts:
    - name: varlog
      mountPath: /var/log
  - name: logging-agent
    image: fluent/fluentd-kubernetes-daemonset:elasticsearch
     env:
      - name:  FLUENT\_ELASTICSEARCH\_HOST
        value: "elastisearch-master"
      - name:  FLUENT\_ELASTICSEARCH\_PORT
        value: "9200"
    volumeMounts:
    - name: varlog
      mountPath: /var/log
  volumes:
  - name: varlog
    emptyDir: {}
Conclusion
Given the ephemeral nature of pods and nodes, it’s very important to store logs from your Kubernetes cluster in a separate storage backend. There are multiple patterns that you can use to set up the logging architecture that we discussed in this article.
Note that we suggest a mix of both sidecar and node-level patterns for your production systems. This includes setting up cluster-wide, node-level logging using a DaemonSet pattern, and implementing a streaming sidecar container for applications that do not support writing logs to stream (stdout/stderr) or that don’t write in a standard log format. This streaming container will automatically surface logs for node-level agents to be picked up.
For the choice of storage backend, you can choose self-hosted, open-source solutions such as Elasticsearch, or you can go the managed service route with options like cloud-hosted Elasticsearch, Stackdriver, or Cloudwatch. The choice of backend that’s right for you will depend on the cost, query, and log analysis requirements that you want to implement with your architecture.
For our latest insights and updates, follow us on LinkedIn

Posted on October 26, 2021
Join Our Newsletter. No Spam, Only the good stuff.
Sign up to receive the latest update from our blog.


