JVM Profiling in Action

Carc
Posted on April 18, 2024
Unlocking the full potential Java applications requires a deep understanding of their behavior and performance characteristics. JVM profiling serves as a powerful toolset for uncovering bottlenecks, identifying resource inefficiencies, and optimizing the performance of Java applications.
In this tutorial, We'll explore real-world code examples, iteratively applying optimizations based on the insights gained from profiling tools. Our goal is simple: to show how to maximize the efficiency, responsiveness, and scalability of Java applications through targeted performance enhancements.
The code
We'll be optimizing a piece of code that processes an access log containing JSON-formatted entries. Each entry in the log represents an access to a specific application, providing information such as the app_id and timestamp of the access.
The objective of the code is to calculate the number of accesses per second, offering valuable insights into the application's usage patterns and performance metrics.
class AccessLogAggregator {
    Map<OffsetDateTime, Long> accessBySecond(Path path) throws IOException {
        return Files.lines(path) //
                .map(this::parseLineJson) //
                .filter(AccessLogLine::isValid) //
                .collect(Collectors.groupingBy(a -> a.date.truncatedTo(ChronoUnit.SECONDS), Collectors.counting()));
    }

    AccessLogLine parseLineJson(String line) {
        var jsonLine = new org.json.JSONObject(line);
        var appID = jsonLine.getString("app_id");
        var date = OffsetDateTime.parse(jsonLine.getString("timestamp"));
        return new AccessLogLine(appID, date);
    }

    record AccessLogLine(String appID, OffsetDateTime date) {
        private static final Pattern APP_ID_VALID_REGEX = Pattern.compile("^[a-zA-Z0-9]+$");

        boolean isValid() {
            return APP_ID_VALID_REGEX.matcher(appID).matches();
        }
    }
}
As our site gains popularity, processing these files in parallel no longer suffices, as it still leads to longer processing times. Therefore, we must focus on optimizing this particular piece of code to ensure efficient handling of the increasing workload.
The profiling
Let's begin by measuring the current process time. To do this, we'll repeatedly process a single access log file, profiling the execution and measuring its execution time.
The profiling code will ran with the following specs:
openjdk version "21.0.1" 2023-10-17 LTS
OpenJDK Runtime Environment Temurin-21.0.1+12 (build 21.0.1+12-LTS)
OpenJDK 64-Bit Server VM Temurin-21.0.1+12 (build 21.0.1+12-LTS, mixed mode)
Chip: Apple M1 Pro
Total Number of Cores: 8 (6 performance and 2 efficiency)
Memory: 32 GB
We'll use async-profiler and flame graphs for profiling. To simplify the process, we'll run the code using JBang.
public static void main(String[] args) throws IOException {
    var path = Path.of("access.log");
    var aggregator = new AccessLogAggregator();

    var t0 = System.currentTimeMillis();
    for (int i = 0; i < 10; i++) {
        aggregator.accessBySecond(path);
    }
    System.out.println("Elapsed time: " + (System.currentTimeMillis() - t0) + " ms");
}
$ jbang --javaagent=ap-loader@jvm-profiling-tools/ap-loader=start,event=cpu,file=profile.html AccessLogAggregator.java

Profiling started
Elapsed time: 1810 ms
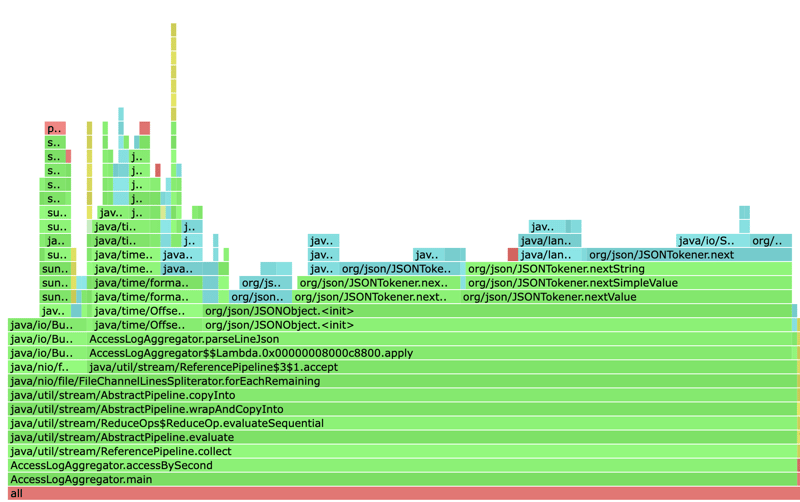
Now that we have established a baseline, let's review the generated flame graph to begin optimization.
Most of the time is spent in JSON parsing, specifically in AccessLogAggregator.parseLineJson. Within parsing, the majority of time is spent in org/json/JSONObject.<init>. Since there are faster JSON libraries available, we'll switch to Gson and repeat the tests. To do this, we'll add the following method to our code:
AccessLogLine parseLineGson(String line) {
    var jsonLine = JsonParser.parseString(line).getAsJsonObject();
    var appID = jsonLine.get("app_id").getAsString();
    var date = OffsetDateTime.parse(jsonLine.get("timestamp").getAsString());
    return new AccessLogLine(appID, date);
}
$ jbang --javaagent=ap-loader@jvm-profiling-tools/ap-loader=start,event=cpu,file=profile.html AccessLogAggregator.java

Profiling started
Elapsed time: 876 ms
We achieved a 2x performance improvement by switching JSON libraries. Now, let's examine our updated flame graph.
Now that the JSON parsing time has decreased, we see that timestamp parsing, specifically java/time/OffsetDateTime.parse, is taking a significant amount of the total parsing time. Java's built-in timestamp parsing is notoriously slow. Luckily, a faster alternative exists: https://github.com/ethlo/itu.
Let’s modify the code again replacing the timestamp parsing
AccessLogLine parseLineGson(String line) {
    var jsonLine = JsonParser.parseString(line).getAsJsonObject();
    var appID = jsonLine.get("app_id").getAsString();
    var date = ITU.parseDateTime(jsonLine.get("time").getAsString());
    return new AccessLogLine(appID, date);
}
$ jbang --javaagent=ap-loader@jvm-profiling-tools/ap-loader=start,event=cpu,file=profile.html AccessLogAggregator.java

Profiling started
Elapsed time: 651 ms
This time, we achieved a smaller but still important performance improvement of 1.35x, particularly when processing thousands of files. Let's examine the flame graph again.
It's clear that the proportion of total parsing attributed to timestamp parsing has decreased after its replacement.
Wrap up
After implementing the two improvements, we achieved an overall performance enhancement of 2.8 times compared to the initial code.
If you look at the code again you’ll notice that we validate each app_id to be alphanumeric. We employ a regex for this, which is typically known for its slow speed. Before profiling, we might have considered replacing regex validation with a manual method using Character.isLetterOrDigit. However, the flame graph reveals that this would have been a clear case of premature optimization because the validation's impact on the total time is minimal.
By using a regex, we maintain the flexibility to further modify the pattern for what we consider a valid app_id without having to modify our code.
In summary, profiling gave us valuable data-driven insights. This enabled us to optimize effectively, avoid unnecessary changes, measure performance improvements, and facilitate an iterative optimization process.
References
https://xam.dk/blog/jbang-reproducers/
https://someth2say.wordpress.com/2023/06/04/jbang-and-flame-graphs/

Posted on April 18, 2024
Join Our Newsletter. No Spam, Only the good stuff.
Sign up to receive the latest update from our blog.


