Bruno Drugowick
Posted on July 26, 2020

There's a lot going on related to cloud services, libraries, providers etc. In fact, everything cloud-related gets a lot of attention right now.
One thing I wanted to try was distribute tracing. Spring has a very interesting project under the Spring Cloud umbrella, called Spring Cloud Sleuth, that auto-configures your app to work with distributed tracing tools.
Together with this project you have Spring Cloud Zipkin Client that takes your instrumented log information and sends it to a Zipkin server. The server provides a clean and easy to use interface to understand the relationships between your services.
The Demo
Description
To explore the projects I developed 3 "layers" of services that talk to each other. The first layer contain only one service (service-one) and requests data from the second layer, comprised of two services (service-two, service-three).
At this point we can talk about Spring Cloud Load Balancer. This project is used to configure client-side load-balancing on the service-one for the second layer of services. The picture below shows how the services relate to each other.
Any service of the second layer then calls the service from the third layer (service-four). The list of services the request went through is put together and returned to the client by service-one.
The two possible responses to a call to service-one/info are:
//Using service-two on the second layer

{
  "info": {
    "Service 4": "Wow, request arrived this far!",
    "Service 2": "ok",
    "Service 1": "ok"
  }
}
//Using service-three on the second layer

{
  "info": {
    "Service 4": "Wow, request arrived this far!",
    "Service 3": "ok",
    "Service 1": "ok"
  }
}
Service-one will unevenly load-balance between service-two and service-three because there's a Thread.sleep(200) on service-three.
Running
To make it easy to run your own tests and see the distributed tracing in action, I've prepared a repository with the four services described above and a .jar for the Zipkin server.
 brunodrugowick
/
distributed-tracing-demo
A demonstration of the usage of Spring Cloud Sleuth and Zipkin to trace requests across Spring Boot services.
Clone it and just run /scripts/start-all.sh. If you have Java 11 and Apache Bench (and a GNU/Linux operating system), everything runs and perform 10 thousand requests to fill your Zipkin server with some data.
The trace
After waiting for a couple of minutes for the tests to run, the script instructs you to go to http://localhost:9411. Let's explore it a bit...
Zipkin server
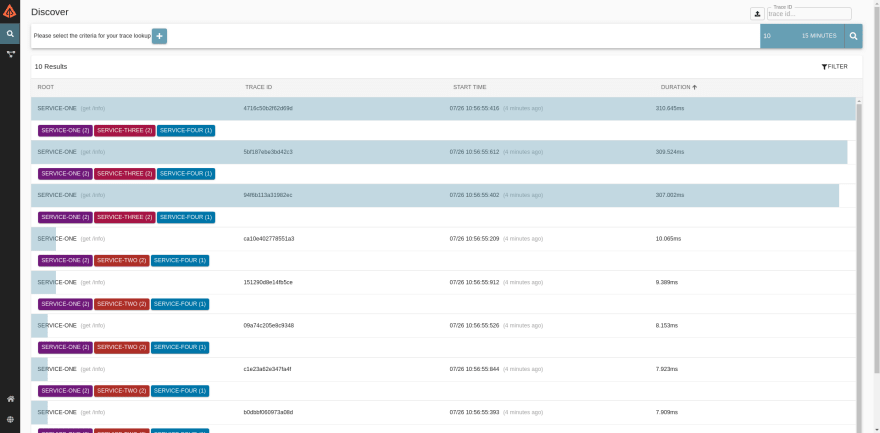
After searching for traces by clicking on the search icon, that's what the homepage looks like:
A very useful feature is the ability to filter traces based on the service name:
Inspecting a trace gives you this view, where you can easily see how long the request took in every service:
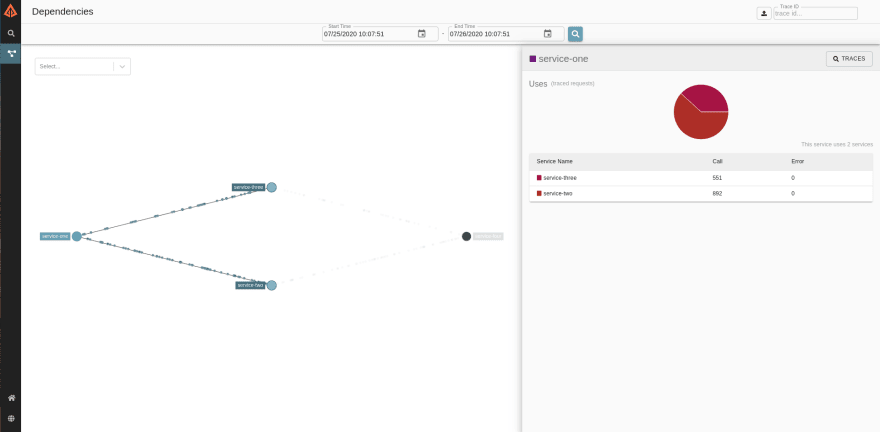
Finally, a very useful feature is understand your services dependencies using the Dependencies Page. Make sure you select a Start and End time and click the magnifier glass icon:
AQAP Series
As Quickly As Possible (AQAP) is a series of quick posts on something I find interesting. I encourage (and take part on) the discussions on the comments to further explore the technology, library or code quickly explained here.
Image by Jason King por Pixabay

Posted on July 26, 2020
Join Our Newsletter. No Spam, Only the good stuff.
Sign up to receive the latest update from our blog.


