Dmitrii Bormotov
Posted on July 14, 2022

Ahoy, mate!
This topic may be useful for those who started test automation in Node.js recently. The article is written in POV of test automation engineer, but I'm sure that every other beginner in Node.js will find it useful.
What's debugging and why I'd need it?
Debugging is the process of finding and resolving bugs. In other words, when we run some code and it doesn't act as expected - we seek for lines of code that cause this misbehaviour.
There are two ways of getting information from your code:
- Logging.
- Attaching a debugger.
Logging
I think you're already familiar with this one. When you execute some command, you simply use console.log() to log its result into console.
const result = 2 + 3
console.log(result) // 5
or
const response = await axios.get(url)
const body = response.data
console.log(body)
Sounds familiar?
Attaching a debugger
Instead of logging every inch of your app, it'd probably be a good idea to just point a few lines of code in your project where you'd like to stop for a while and inspect what's going on at these specific lines.
Let's say that we execute an HTTP request with Axios and for some reason your tests are failing and you see that response body doesn't match the one that expected.
Time to log this sh attach a debugger!
Visual Studio Code
First, simply mark a line of code (click to the left of the line number) where you'd like to stop when your tests will be executed. There red dots are breakpoints.

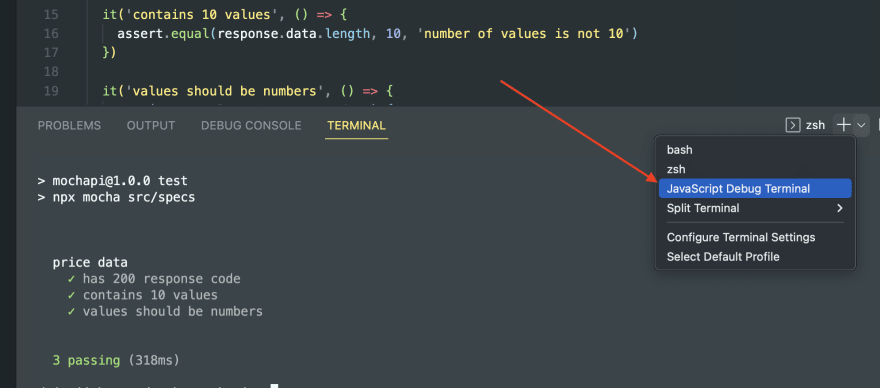
After that, instead of using your regular terminal, open `JavaScript Debug Terminal:

In this terminal you may simply use the command that you were using to execute your tests (like npm test) as usual.
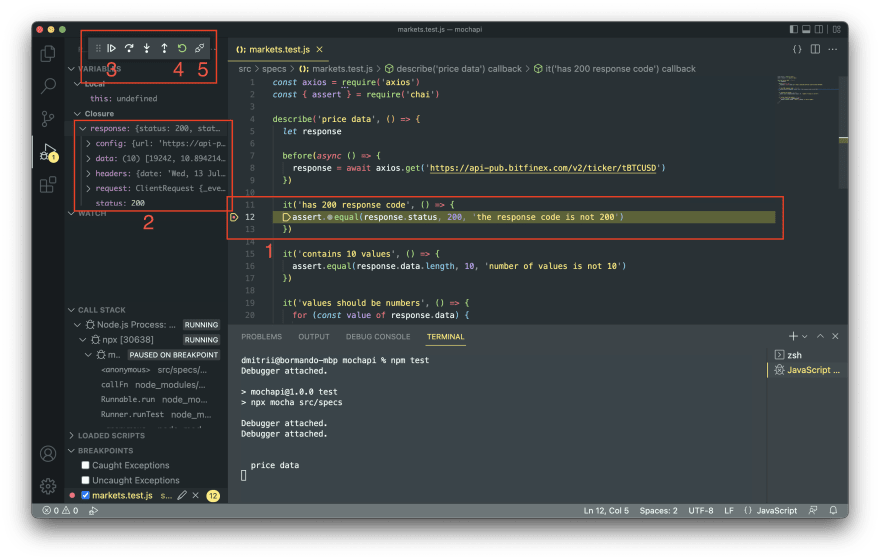
Your test run will make a stop at the breakpoint (1). You'll see the cached data that you may reach from the current line of code (2).
You may go to the next breakpoint from there (3) or restart your current run (4) or detach debugger (5).
You may find other ways to attach a debugger in VSC, but I prefer this one.
WebStorm
It's pretty similar to Visual Studio Code in the first step - you mark the line of code that you need as a breakpoint:
And then you run your code almost as usual, but use debug (bug) icon instead:
Your test run will make a stop at the breakpoint (1). You'll see the cached data that you may reach from the current line of code (2).
You may go to the next breakpoint from there (3) or restart your current run (4) or stop execution (5).
Conclusion
Debugger helps us with inspection of the data that we store in application's cache. You don't need to add console.log() anymore to see what's going on (especially, if there's more than one thing that you want to log).
I think most of you'll agree that this method is more useful and interactive than logging. Plus, it's more readable when you have a lot of data to process (like a very long array or an object), since you can fold/unfold whole sections (objects/arrays).
Thanks for reading, hope you've learned something new.

Posted on July 14, 2022
Join Our Newsletter. No Spam, Only the good stuff.
Sign up to receive the latest update from our blog.


