Running the OpenTelemetry Demo App in Kubernetes

Adriana Villela
Posted on October 28, 2022

If you’re new to OpenTelemetry and want to see it in action in a real-life example, the OpenTelemetry Demo app is a great way to get started quickly. In one of my previous blog posts, I showed you how to get the demo app up and running and sending Traces to Lightstep. That’s all well and good, but we all know that in “The Real World”, we’re not running our containerized workloads locally with Docker Compose. Instead, we’re running them using container orchestrators such as Kubernetes and Nomad. Keeping that in mind, wouldn’t it be so very very nice if we could run the OpenTelemetry Demo app in Kubernetes? And wouldn’t it be super extra nice if we could send those Traces to Lightstep?
Well, look no further, my friend, because today, that is exactly what we’re going to do!
Are you ready? Let’s do this!
Tutorial
Pre-Requisites
Before you begin, you will need the following:
- A Lightstep account
- A Lightstep Access Token for the Lightstep project you would like to use
- A Kubernetes cluster
- Helm
NOTE: The version of the OpenTelemetry Demo App used at the time of this writing was version
0.9.6.
Steps
1- Initialize Helm
helm repo add open-telemetry https://github.com/open-telemetry/opentelemetry-helm-charts
2- Create the values YAML file
The OTel Demo App Helm Chart expects a values.yaml file. Now, the one that comes out-of-the-box with the chart is all well and good, but it sends Traces to Jaeger. In our case, since we want to send Traces to Lightstep, we’ll need to modify it a tad. Let’s start by creating our own values YAML file:
touch values-ls.yaml
And then open values-ls.yaml and add:
mkdir otel-demo-ls
tee -a values-ls.yaml <<EOF
opentelemetry-collector:
  nameOverride: otelcol
  mode: deployment
  extraEnvs:
    - name: LS_TOKEN
      valueFrom:
        secretKeyRef:
          key: LS_TOKEN
          name: otel-collector-secret
  resources:
    limits:
      memory: 100Mi
  config:
    exporters:
      otlp/ls:
        endpoint: ingest.lightstep.com:443
        timeout: 30s
        tls:
          insecure_skip_verify: true
        headers:
          "lightstep-access-token": "${LS_TOKEN}"

      otlp:
        endpoint: '{{ .Release.Name }}-jaeger:4317'
        tls:
          insecure: true

      logging:
        logLevel: debug

    processors:
      resource:
        attributes:
        - key: service
          from_attribute: service.name
          action: insert
      resource/add_container:
        attributes:
        - key: container
          from_attribute: service.name
          action: insert

    service:
      pipelines:
        metrics:
          exporters:
            - logging
            - otlp/ls
          processors:
            - resource
        traces:
          exporters:
            - logging
            - otlp
            - otlp/ls
          processors:
            - resource/add_container
EOF
NOTE: I had originally left out Jaeger and Prometheus configurations for the sake of keeping things simple. If you'd like to see an example of with both, check out this here. (Thank you Vamsee Lakamsani for the share!)
Your file should look like this one. Okay...so what exactly did we do?? So glad you asked!
Well, in a nutshell, we’re overriding the values.yaml in the OpenTelemetry Demo App Chart. But we’re only overriding the bits that we need to override - specifically, the OTel Collector configuration, so we can send Traces to Lightstep. It looks an awful lot like the Collector config YAML that we know and love. But not quite. Because it’s just a partial config of the Collector config. You see, Demo App Chart uses the OpenTelemetry Collector Helm Chart as a subchart. All the configuration that the Collector Chart exposes is available to us in the Demo Chart. So when you’re populating your own version of values.yaml, all you need to do is include the Collector configs that you wish to modify or add to. In our case, we’re doing the following:
- Configure a new exporter,
otlp/ls, which allows us to send traces to Lightstep - Add the new exporter to our
metricsandtracespipelines - Update the
loggingexporter to use thedebuglog level.
You’ll notice that in configuring the otlp/ls exporter, we’re setting the following header value: "lightstep-access-token": "${LS_TOKEN}". But where in Space does ${LS_TOKEN} come from?? Great question! Which brings me to the second noteworthy section.
You may have noticed the extraEnvs section in our opentelemetry-collector config. Well, this is where we can configure environment variables that are mounted to our Collector pod in Kubernetes. We don’t wish to expose our secret in values-ls.yaml, as that would be a security no-no. Instead, we reference a secret called otel-collector-secret, which is mounted as the environment variable, LS_TOKEN. Ta-da! 🎉
PS: We’ll create the secret in the next step.
NOTE: I am fully aware of the fact that you won’t want to use Kubernetes secrets In Real Life to store your Lightstep Access Token, as they are only base64-encoded. Instead, you’ll want to store your secrets in a secrets manager, such as one that comes with your Cloud provider (e.g. Azure Key Vault, Google Secret Manager), or HashiCorp Vault.
3- Deploy the app
Now that we know what’s up, let’s deploy the app to Kubernetes!
export LS_TOKEN="<YOUR_LS_TOKEN>"

kubectl create ns otel-demo
kubectl create secret generic otel-collector-secret -n otel-demo --from-literal=LS_TOKEN=$LS_TOKEN

helm upgrade my-otel-demo open-telemetry/opentelemetry-demo -f <path-to-values-ls-file>/values-ls.yaml -n otel-demo --install
Where <path-to-values-ls-file> is the path in which your newly-created values-ls.yaml is located.
Be sure to replace <YOUR_LS_TOKEN> with your own Lightstep Access Token.
4- Access the OTel Demo App
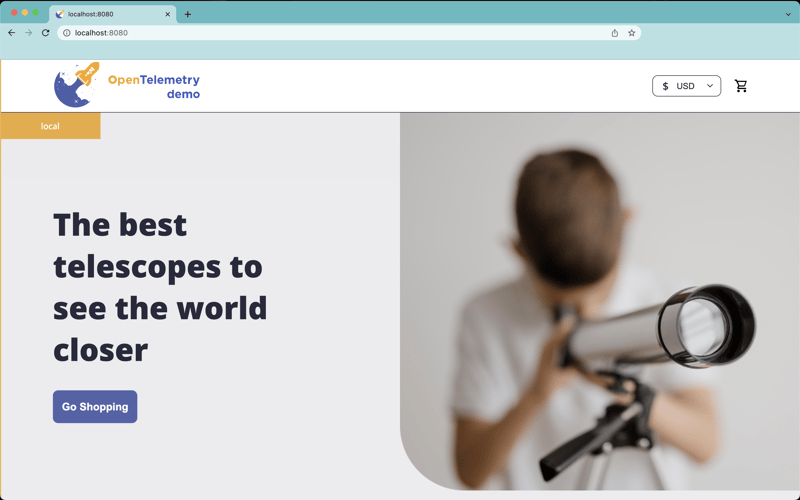
You can access the Demo App by Kubernetes port-forward:
kubectl port-forward -n otel-demo svc/otel-demo-app-frontend 8080:8080
To access the front-end, go to http://localhost:8080:
5- See traces in Lightstep
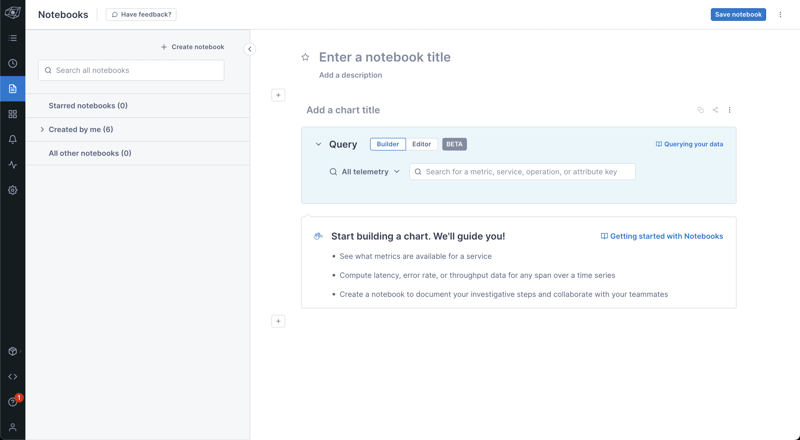
We can now pop over to Lightstep and check out some Traces. Let's do this by creating a Notebook.
First, click on the little page icon on the left nav bar (highlighted in blue, below). That will bring up this page:
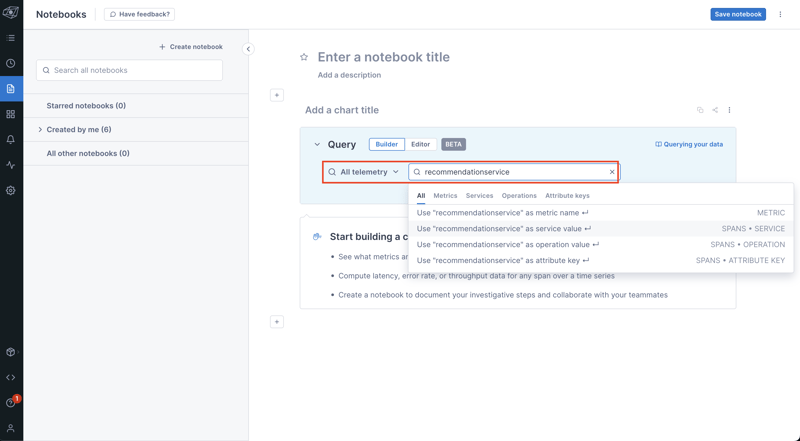
Next, we build our query for our Traces. Let's look at the traces from the recommendationservice. We'll do by entering recommendationservice in the field next to "All telemetry". Because this is a service, select the second value from the drop-down, which says, "Use 'recommendationservice' as service value", as per below:
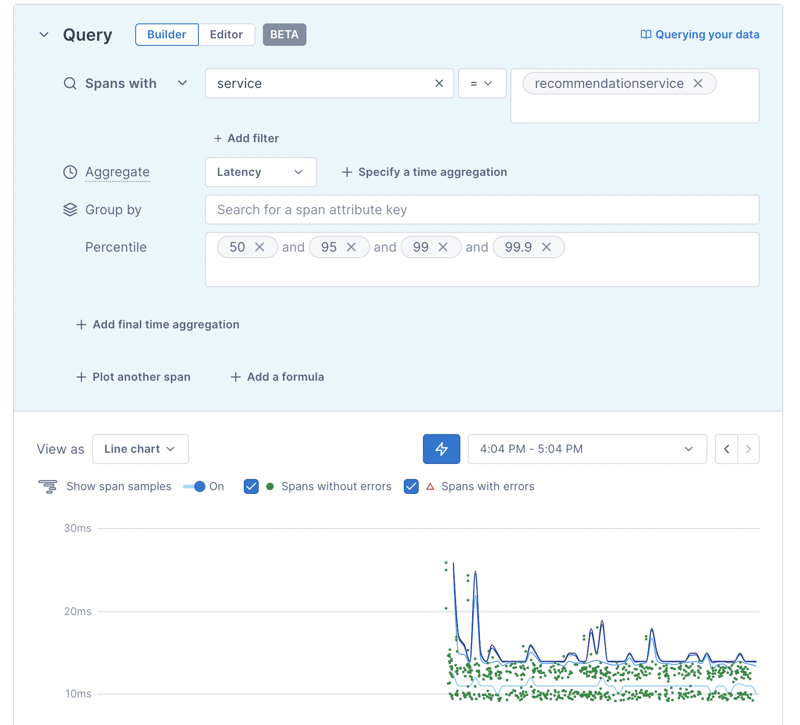
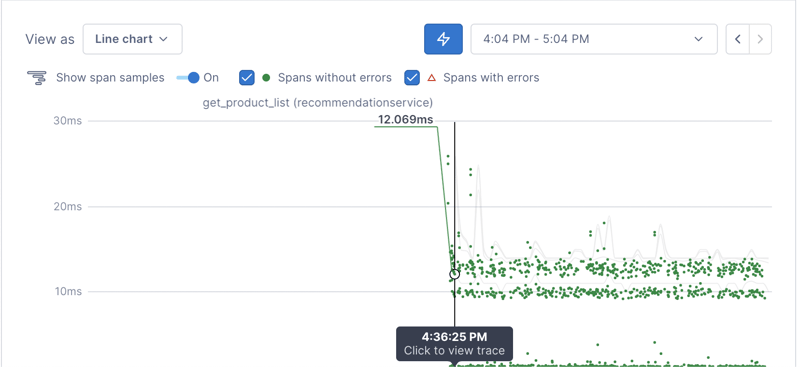
After you select that value, you'll see a chart like this:
The little green dots represent trace exemplars from that Service. Hover over one of them to see for yourself!
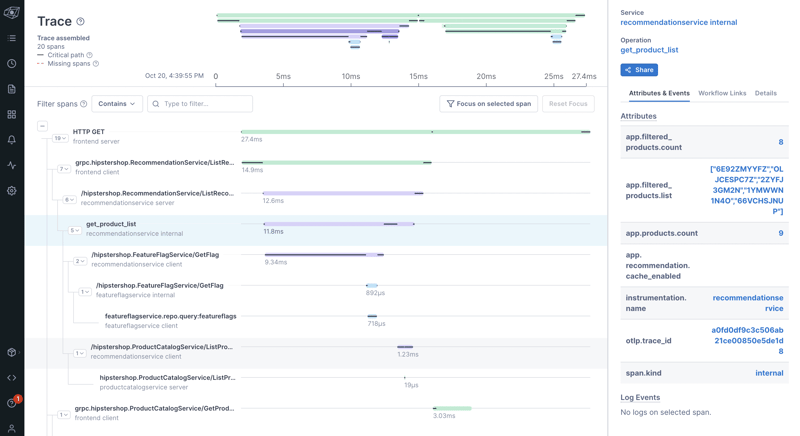
If you click on one of these dots, you'll get taken to the Trace view. Before you click, be sure to save your Notebook first (don't worry, you'll get a reminder before you navigate away from the page)!
Here's the Trace view we see when we click on the get_product_list dot (Operation) above:
Final Thoughts
Today we upped our OpenTelemetry Demo App game, and moved from running it à la Docker Compose, to deploying it to Kubernetes. We did this, thanks to the OpenTelemetry Demo App Helm Chart, and we used our own version of values.yaml so that we could send Traces and Metrics to Lightstep.
This should give you a nice feel for running a full-fledged OTel-instrumented app in Kubernetes!
And now, I shall reward you with a picture of Ollie Octopus painting, drawn by my superly-talented 14-year-old daughter.
Peace, love, and code. 🦄 🌈 💫
The OpenTelemetry Demo App is always looking for feedback and contributors. Consider joining the OTel Community to help make OpenTelemetry AWESOME!
Got questions about today’s blog post? Talk to me! Feel free to connect through e-mail, Twitter or LinkedIn.
Hope to hear from y’all!

Posted on October 28, 2022
Join Our Newsletter. No Spam, Only the good stuff.
Sign up to receive the latest update from our blog.
