Ruby Call Path Analysis using TracePoint

Alex Bevilacqua
Posted on May 7, 2021

During a recent diagnostic analysis exercise I needed to identify if there was additional "work" being done based on a single option being changed. As Ruby offers numerous productivity tools for developers it should come as no surprise that a mechanism to easily produce a full call stack for one to many operations exists.
The code below is using the MongoDB Ruby Driver and Mongoid ODM to $sample a single document with a Read Preference passed in from the command line. The collection likely won't exist however the goal of this analysis was simply to see what differences changes the read preference would expose.
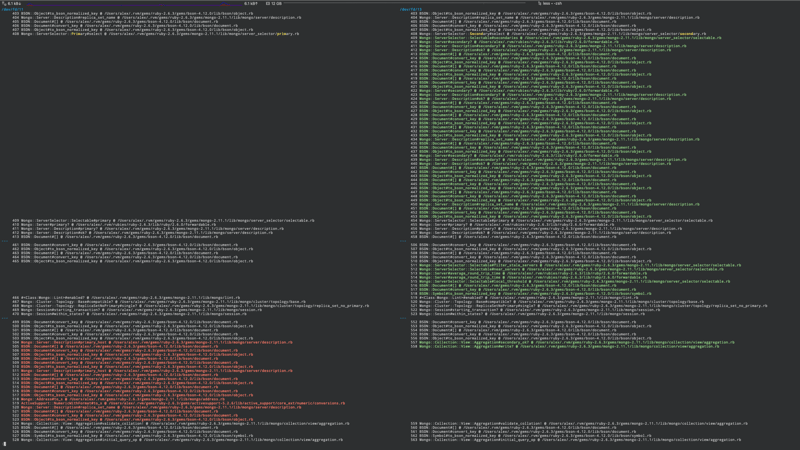
For the purposes of my analysis I wanted to produce a diff of two call stacks to try and see "where" there may be a difference in the amount of "work" being performed. To do this the first step was to introduce instrumentation via a TracePoint.
# test.rb
# ruby test.rb [primary|secondary]
require 'bundler/inline'
gemfile do
  source 'https://rubygems.org'

  gem 'mongoid', '7.0.4'
  gem 'mongo', '2.11.1'
end

Mongoid.configure do |config|
  config.clients.default = { uri: "mongodb+srv://..." }
end

class Sample
  include Mongoid::Document
end

def with_tracepoint
  trace = []
  tp = TracePoint.new(:call) do |x|
    trace << "#{x.defined_class}##{x.method_id.to_s} @ #{x.path}"
  end
  tp.enable
  yield
  return trace
ensure
  tp.disable unless tp.nil?
end

# first argument to symbol
read_pref = ARGV[0].nil? ? :primary : ARGV[0].to_sym
# run first command to establish a connection
Sample.collection.aggregate([{ :'$sample' => { size: 1 } }], read: { mode: read_pref }).first
trace = with_tracepoint do
  Sample.collection.aggregate([{ :'$sample' => { size: 1 } }], read: { mode: read_pref }).first
end

puts trace
The above will trace all Ruby method calls executed within the block and push them in to an array. By running the above script twice with different options and feeding the results into a diff tool (such as icdiff) a visual representation of how the call stacks differ can be generated.
icdiff -N <(ruby test.rb primary) <(ruby test.rb secondary) | less
(Open screenshot in a new tab to get a better look)
The with_tracepoint helper method in the script above is only filtering on :calls, however can easily be modified to filter based on your particular needs (see TracePoint Events for the full list).
Let me know if this approach helped you troubleshoot a particular issue or identify an interesting defect.
Happy Coding!

Posted on May 7, 2021
Join Our Newsletter. No Spam, Only the good stuff.
Sign up to receive the latest update from our blog.

