Monitoring Network Traffic With Automation Scripts

Akshaypai
Posted on April 17, 2019

According to Wikipedia, “A test script in software testing is a set of instructions that will be performed on the system under test to test that the system functions as expected.” However, what purpose do these test scripts solve?
These test scripts, or in simple terms, a short program (written either using functional GUI test tools or in programming languages) are focused on testing functionalities of a software system. Moreover, this testing can either be executed manually or using an automated pattern. Also, since we live in an era where machines are taking over manual labour, automation seems like the better option.
What is automation testing?
A simplified process of developing a program to test software, automation testing reduces human effort. An automation testing program or script, written by developer uses test data. The data is automatically entered to generate output. This further creates an analysis of the entire data, measuring the efficiency of the program.
But Why do we need to automate the testing process?
As the name itself implies, automating specific tasks can profoundly reduce the effort required in addition to the investment of time and money. Automating a process means, no more human interaction for long hours to verify the working. It slashes the scope of human error, increases efficiency, and the scope of work.
Today we’ll discuss how automation scripts can help you to check network traffic.
What is network traffic?
Network traffic, in simple terminology, is the amount of data travelling through a network. Precisely put, the network traffic includes the entire exchange of data between a browser and a server. For instance, when opening a website, downloading images, text and any other templates are included in the network traffic.
Traffic inspection for a web application
Now that we know what traffic is, let’s understand why it is necessary to monitor the traffic. For any web, application efficiency is the most critical factor. Also, one would like to keep a check on network usage and any possible data drain. Analyzing the traffics gives us such insights, making it easier to find solutions.
The process of inspecting traffic is simple. Once all the requests have been triggered on a web page, it is easy to collect the responses which in turn help the user find out the shortcomings (if any). This will help measure all the functioning and create reports to analyze the statistics.
What should be looked for?
Whenever traffic monitoring is done, several parameters need special attention to get maximum accuracy.
- HTTP Requests: HTTP requests are packets of information communicated between the browser and the server. The higher the number of applications, the lower is the experience of the user. Browser caching is one technique which can bring down the number.
- HTTP Response: The time taken for the packet communication of the response needs to be reported precisely.
- Load Time: This includes the entire set of resources which have to be loaded for the webpage to open. This includes text, media, and other plugins.
- Failed Requests: There might be errors in the application or there might be some network issues. This leads to failed requests. Status Code of a Response will indicate if the request failed or succeeded. For example, a status code of 400 indicates that the request made was incorrect, or a status code of 500 indicates that the application had issues processing the request. A lot of failed requests might indicate some serious issues in the application.
- IP Address: requests from IP addresses need to be monitored. unusually high number of requests from the same IP address could mean that someone might be trying to attack your website with a DoS(Denial of Service) Attack. This will also allow you to discover what is the typical number of requests made per IP address per session.
- Location: Though it might not be possible to determine the originating location of all traffic, a majority of it can be monitored. This will help you in analyzing the various regions from which your website is getting traffic and you can apply your business intelligence to determine if there are anomalies or a potential market opportunity.
How to Capture Network Traffic
Capturing network traffic requires specialized tools that monitor the network in which it is deployed. These tools aggregate, segregate, apply user-provided rules and visualize various aspects related to network traffic. Here are some of the most popular tools used for this purpose.
1. Wireshark
Wireshark is one of the most widely used network monitoring tools today. A free and an open source tool, Wireshark equips you with a packet analyzer that can go to microscopic levels of networking monitoring.
It has some powerful features such as a feature-rich GUI for monitoring, a pluggable interface to monitor a new type of protocol, live data connection to ports, multi-protocol scalable dissectors, and more. You can learn more about Wireshark through their official video guides.
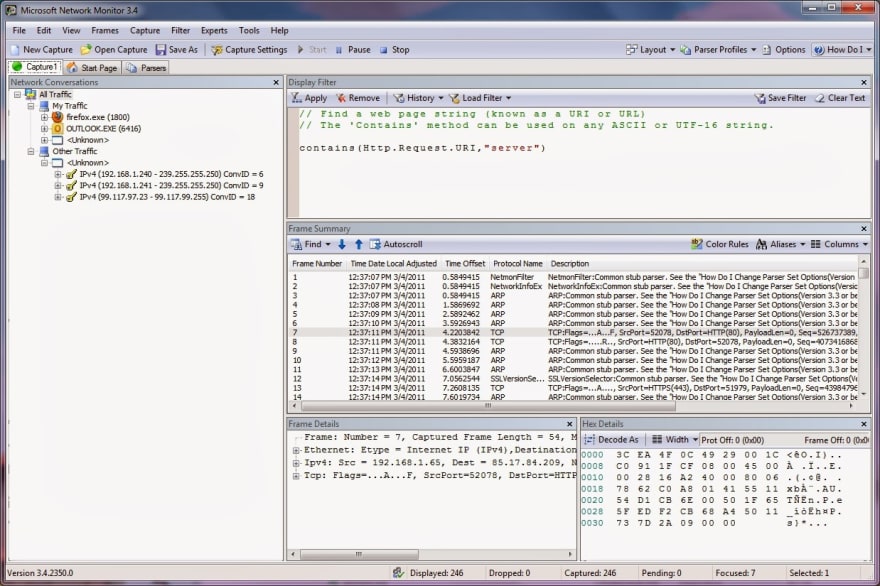
2. Microsoft Network Monitor
If you are on a windows machine, you can use the inbuilt network monitoring tool to capture and analyze your network traffic. Apart from the broader capabilities of capturing traffic through the adapters or even the subnets, this tool can be used for much finer operations.
Performing detailed tasks such as frame filtering and frame analysis can be easily performed via this tool and it provides a summary of each frame that eases the user’s work. Microsoft’s Technet guide on the monitoring tool will help you set it up and learn more about the capabilities and restrictions of this wonderful tool.
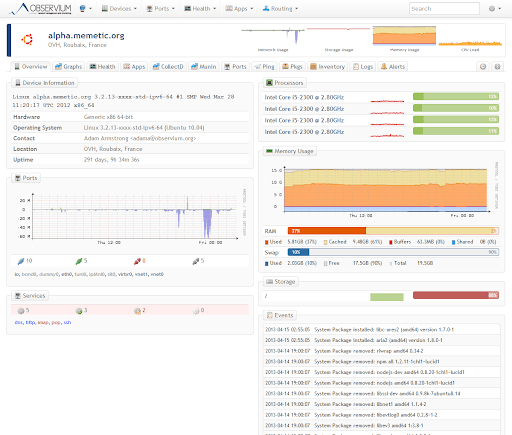
3. Observium Community
When the goal of traffic monitoring is to have an eye on the health of the network, it becomes imperative to monitor each device state and the communication that occurs within the network. For such purposes, this multi-OS network monitoring tool Observium performs extremely well.
Observium will help you to improve visibility within your network. With features such as device auto-discovery, health checks of existing devices and reporting features makes it one of the most sought-after tools for discovery and status check use cases.
Integration of Automation and Traffic Monitoring
Now that you have the required parameters and the resources to fetch the data and get results, traffic monitoring seems simple, right? Well, it might. However, would it be as good as an automated process? Let’s have a look!
With an automated traffic monitoring model, the automation script enables sample data to be pitched in to generate situation based results.
Moreover, the use of automation scripts and tools can reduce the expenses involved as well as manual effort. An automated script not only reduces cost but also cuts down on the scope of human error. This consists of the simulation of bandwidth and latency whenever required. Its benefit being filtration of specific URL patterns in an attempt to get maximum data for analysis. Traffic monitoring with the help of automation scripts also helps gain insights in real time.
A very common saying goes by as,” Prevention is better than cure.” Also, that is precisely what automation enables the user to do. Before shipping out the actual product, any potential problem will be reported. For any organization looking to grow with an efficient system of working and satisfied employees as well, automation is the key to an unbeaten run.
It goes without a doubt that automating the monitoring process is one more step towards delivering a more successful product.
Related Post

Posted on April 17, 2019
Join Our Newsletter. No Spam, Only the good stuff.
Sign up to receive the latest update from our blog.


