Understand Golang channels and how to monitor with Grafana (Part 2/2)

Ahmed Ashraf
Posted on December 9, 2019

In the first part, we talked about what are go channels and how they work and how to implement them in a scalable way.
In this part, I'll show you how to monitor them and get some useful metrics like processing time per worker. How many jobs running per minute. And some other stuff
Stack
let's take a small brief of the tools we will use to do the job.
Prometheus: is an open-source time-series metric system. also, it supports alerts but it's not our topic for today.
Grafana: is an open-source analytics & monitor solution that supports many data sources and we will use it with Prometheus to display the metric we fire from our Go app.
Prometheus
first, we need to define the metrics in our app and register them in Prometheus package. but let's define the types of the metric and what is the purpose of each one.
Counter: a number that can only increase or reset to zero. like how many emails you sent. it can't be at some time 5 then became 3. it can only increase.
Gauge: represents a single numerical value that can arbitrarily go up and down. like memory usage or concurrent users and for our case it's running workers and running jobs. because these numbers go up and down.
Histogram: in just an observer. based on the samples it gives you the average. like response time, response size, request duration.
Summary: It's like a histogram but also it counts the total observations and a sum of all observed values.
I'm not sure I understand summary well. but anyway we don't need it in this article
// prometheus.go

package queue

var (
    JobsProcessed  *prometheus.CounterVec
    RunningJobs    *prometheus.GaugeVec
    ProcessingTime *prometheus.HistogramVec
    RunningWorkers *prometheus.GaugeVec
)

var collectorContainer []prometheus.Collector

//InitPrometheus ... initalize prometheus
func InitPrometheus() {
    prometheus.MustRegister(collectorContainer...)
}

//PushRegister ... Push collectores to prometheus before inializing
func PushRegister(c ...prometheus.Collector) {
    collectorContainer = append(collectorContainer, c...)
}

func InitMetrics() {
    JobsProcessed = prometheus.NewCounterVec(
        prometheus.CounterOpts{
            Namespace: "worker",
            Subsystem: "jobs",
            Name:      "processed_total",
            Help:      "Total number of jobs processed by the workers",
        },
        []string{"worker_id", "type"},
    )

    RunningJobs = prometheus.NewGaugeVec(
        prometheus.GaugeOpts{
            Namespace: "worker",
            Subsystem: "jobs",
            Name:      "running",
            Help:      "Number of jobs inflight",
        },
        []string{"type"},
    )

    RunningWorkers = prometheus.NewGaugeVec(
        prometheus.GaugeOpts{
            Namespace: "worker",
            Subsystem: "workers",
            Name:      "running",
            Help:      "Number of workers inflight",
        },
        []string{"type"},
    )

    ProcessingTime = prometheus.NewHistogramVec(
        prometheus.HistogramOpts{
            Namespace: "worker",
            Subsystem: "jobs",
            Name:      "process_time_seconds",
            Help:      "Amount of time spent processing jobs",
        },
        []string{"worker_id", "type"},
    )

    metrics.PushRegister(ProcessingTime, RunningJobs, JobsProcessed, RunningWorkers)
}
after defining the metrics we need to run our endpoint that Prometheus will call to get the metrics data
r.Handle("GET", "/metrics", gin.WrapH(promhttp.Handler()))
Now if we tried to make some calls
JobsProcessed.WithLabelValues("Worker-1", "ahmedash.com").Inc()
JobsProcessed.WithLabelValues("Worker-1", "ahmedash.com").Inc()

JobsProcessed.WithLabelValues("Worker-2", "ahmedash.com").Inc()
JobsProcessed.WithLabelValues("Worker-2", "ahmedash.com").Inc()
JobsProcessed.WithLabelValues("Worker-2", "ahmedash.com").Inc()
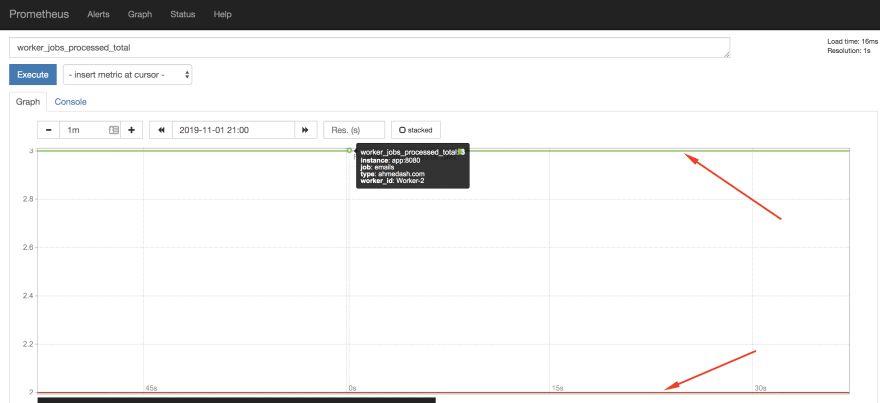
the result when you hit your Prometheus endpoint http://localhost/metrics
and if you opened Prometheus dashboard you will find the chart like below

this is the way of how you can work with Prometheus and send the data to it and check it's dashboard for simple visualization.
but as you can see the dashboard of Prometheus is not that fancy, and we need to create a nice dashboard so it's easy for anyone to understand what is going on with the system. and Grafana can tackle this job very well.
Push the metric from Go to Prometheus
From the first part, we will modify the code to send the data we need for the metrics
Follow arrows ⬅️
func (d *Dispatcher) Run() {
    for i := 0; i < d.maxWorkers; i++ {

        // increase the number of running workers
        RunningWorkers.WithLabelValues("Emails").Inc() ⬅️⬅️⬅️⬅️⬅️⬅️⬅️⬅️

        worker := NewWorker(d.WorkerPool)
        worker.Start()
        d.Workers = append(d.Workers, worker)
    }

    go d.dispatch()
}
With every job. we need to increase the jobs in queue metric
func (d *Dispatcher) dispatch() {
    for {
        select {
        case job := <-JobQueue:

            // Increase running jobs Gauge
            RunningJobs.WithLabelValues("Emails").Inc() ️⬅️⬅️⬅️⬅️⬅️⬅️⬅️

            go func(job Queuable) {
                jobChannel := <-d.WorkerPool
                jobChannel <- job
            }(job)
        }
    }
}
- First metric: stores the number of jobs processed per worker
- Second metric: decreases the number of current jobs running from the previous code snippet
- Third metric: stores the processing time for each job
func (w Worker) Start() {
    go func() {
        for {
            w.WorkerPool <- w.JobChannel

            select {
            case job := <-w.JobChannel:
                startTime := time.Now()

                // track the total number of jobs processed by the worker
                JobsProcessed.WithLabelValues(w.Name, "Emails").Inc() ️⬅️⬅️⬅️⬅️⬅️⬅️⬅️
                if err := job.Handle(); err != nil {
                    log.Fatal("Error in job: %s", err.Error())
                }
                // Decrease the number of running jobs once we finish
                RunningJobs.WithLabelValues("Emails").Dec() ️⬅️⬅️⬅️⬅️⬅️⬅️⬅️

                // ⬇️ Register the proccesing time in the Histogram ⬇️
                ProcessingTime.WithLabelValues(w.Name, "Emails").Observe(time.Now().Sub(startTime).Seconds()) ️⬅️⬅️⬅️⬅️⬅️⬅️⬅️
            }
        }
    }()
}
Grafana
Now we have everything ready and our app is working as expected. the last step we need is just to have a beautiful dashboard with Grafana.
from Grafana dashboard we need to add Prometheus as a data source
then from HOME at the top bar create New dashboard
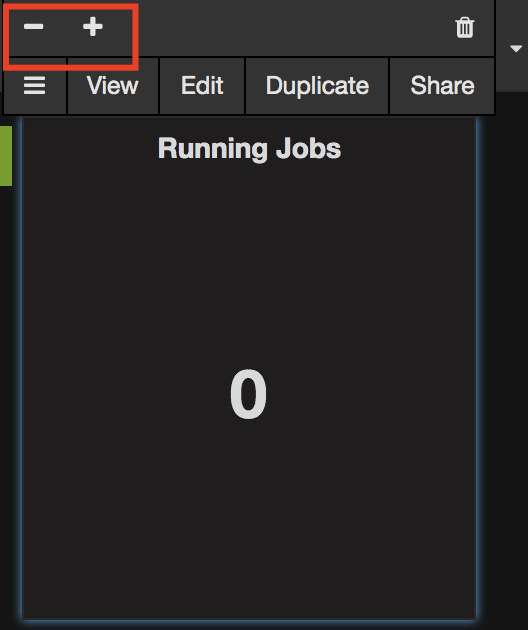
Then we need to add a Singlestat for counters & gauge metrics
Now:
- Let's choose Prometheus from data-sources
- then search for the metric name
- have the full right name of the metric
Then from Options tab choose if it's current or total. in our case it's current
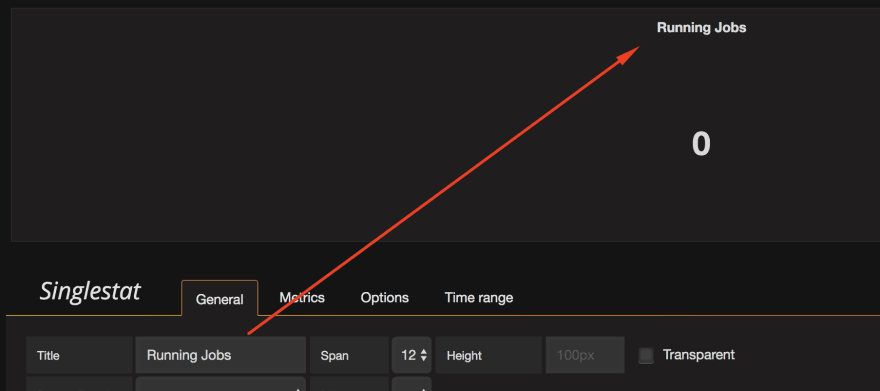
Finally from General tab rename the component
Also, you can control the size of each component in the panel

Let's make another one for the running workers with worker_workers_running metric name
then let's make a graph panel to show how many jobs per minute
Now you can make some requests to the app and see the data in realtime. just make sure to enable the auto-refresh.
Now we have the first part of our dashboard

The second part is just about adding a graph to show the processing duration for each worker
for this metric, the value would be worker_jobs_process_time_seconds_sum / worker_jobs_process_time_seconds_count
and then make sure we display the values in milliseconds
and the final result is
Now we have a dashboard shows us the running workers, how many jobs in queues. jobs processing duration. also, easily we can see if there are any spikes with our jobs or the system works as we expect from him to be.
Conclusion
In this article including the two parts. we learned how to
- create channels
- dispatcher/worker pattern
- how to create&kill workers
- push metrics and display them in a very nice dashboard
Things we didn't cover
- We don't deal with failed jobs. so if an error happens to any job we don't have a way to re-try or even store them for later
- No data persistence. so if the app restarts we will lose all jobs because they are in memory.
- We didn't show how to make this work with a third-party messaging/queuing system like Redis or RabbitMQ.
Source code
This is a source code contains all the code we went through. should be easy to run as it's dockerized.
https://github.com/ahmedash95/go-channels-demo
References
These 2 articles helped me a lot to understand how I can build powerful apps that support async jobs and monitor them. only my article combines knowledge from.

Posted on December 9, 2019
Join Our Newsletter. No Spam, Only the good stuff.
Sign up to receive the latest update from our blog.


